What Is a Last Frost Date? What the 10%, 30%, 50% and 90% Odds Mean
Every last frost date is a probability. Here is what each of NOAA’s odds means, why sources quote different dates for the same town, and how often the dates held up in real springs.
- Last reviewed Oct 7, 2026
- 13 cited sources
- 6 min read
Set your ZIP to see dates for your area.
- 1A last frost date is when a 32°F spring night becomes unlikely at the nearest NOAA station, from 1991–2020 records.
- 2The 50% date, often called the “average”, still has a freeze after it one spring in two; the 10% date, one in ten. The 90% date is the early one.
- 3Sources mean different odds: 50% (University of Missouri), 30% (Old Farmer’s Almanac), 10% (Garden Safe), under 5% (UC Master Gardeners).
- 4In our test at 967 airport stations, 42–52% of springs from 2021 to 2026 froze after the 50% date and 6–9% after the 10% date, close to the stated odds.
- 5Where frost is rare the dates are conditional: Tampa’s 50% date carries about a 17% chance of a later freeze, not 50%.
A last frost date is the spring date after which a 32°F night becomes unlikely at a nearby weather station, based on 30 years of records. It is a probability, not a deadline: the “average” date still has a freeze after it one spring in two, the safer 10% date about one in ten.1,2
We tested those odds at 967 airport weather stations. A freeze came on or after NOAA’s 10% date in 8–13% of springs from 1991 to 2020 and in 6–9% of the six springs since, depending on whether a reading of exactly 32°F counts.4
Last frost date, defined
In the NOAA 1991–2020 U.S. Climate Normals, the last frost date is the last spring night with a low of 32°F or below; the first frost date is the first such night of fall, and the days between are the growing season.1,2 Some sources count a 36°F “frost” or a 28°F hard freeze instead; our frost vs. freeze guide compares the three.
One phrase, four different odds
Publishers attach different odds to “the” last frost date:
| Source | What it calls the last frost date | Chance of a freeze after it |
|---|---|---|
| University of Missouri IPM | The median date | 50% |
| Sunnyside Gardens (Minnesota) | The “average” date, after which planting is “safe” | Not stated |
| Old Farmer’s Almanac | The “average” date, from a 30% threshold | 30% |
| Garden Safe | The “average” date | 10% |
| UC Master Gardeners (UC ANR) | A probability-based date | “less than about a 5% chance” |
| Google AI Overviews (two searches) | The “average final day” | “30% to 50%” in one, “10% to 30%” in the other |
Sources: Missouri,9 Sunnyside,8 the Almanac,5 Garden Safe7 and UC ANR.6 So two neighbors can quote dates two weeks or more apart and both be right. Ask which percentage a date is; our frost dates lookup shows the 90%, 50%, 30% and 10% dates for your ZIP code side by side.
What the 90%, 50%, 30% and 10% dates mean
NOAA defines each spring date as
the probability that the last spring freeze will occur on or after the specified date
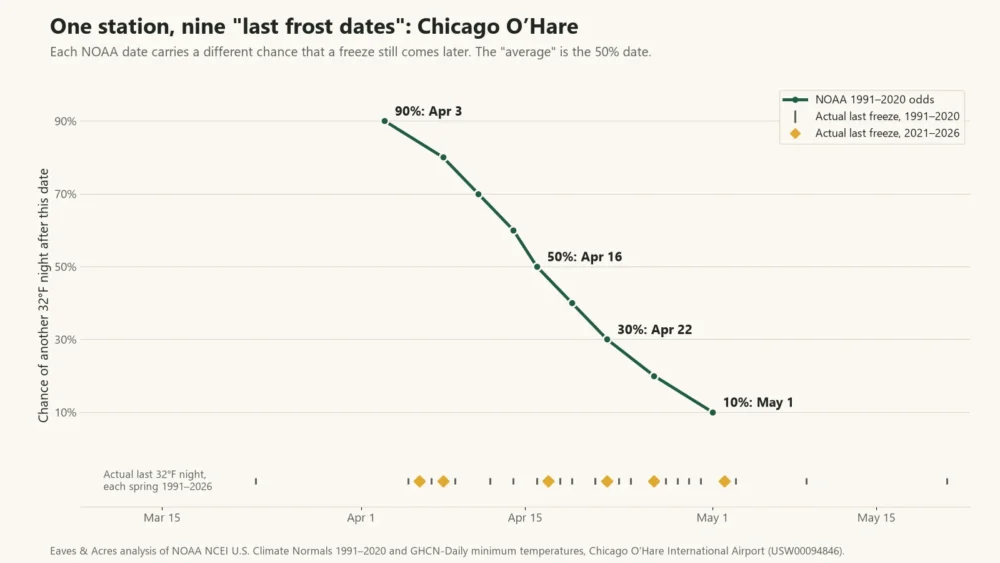
A lower percentage means a later, safer date. Here are all nine for Chicago’s O’Hare airport:
| NOAA level | Date | Chance of a later freeze | Springs with 32°F or colder on or after it |
|---|---|---|---|
| 90% | Apr 3 | 9 in 10 | 35 of 36 |
| 80% | Apr 8 | 8 in 10 | 32 of 36 |
| 70% | Apr 11 | 7 in 10 | 30 of 36 |
| 60% | Apr 14 | 6 in 10 | 28 of 36 |
| 50% | Apr 16 | 1 in 2 | 27 of 36 |
| 40% | Apr 19 | 4 in 10 | 21 of 36 |
| 30% | Apr 22 | 3 in 10 | 17 of 36 |
| 20% | Apr 26 | 2 in 10 | 11 of 36 |
| 10% | May 1 | 1 in 10 | 5 of 36 |
O’Hare ran late for its odds: 27 of 36 springs froze on or after the 50% date, where the odds predict about 18, and 5 on or after the 10% date, most recently May 2, 2026. Across hundreds of stations the odds hold more closely.
How NOAA calculates a last frost date
NOAA starts with a station’s daily lows for 1991–2020, filling missing days from the five nearest stations. Thirty springs are too few for smooth odds, so it reshuffles month-long stretches of the record into 10,000 simulated years, finds the last 32°F night in each, and lines them up: 10% of those dates fall on or after the 10% date.2
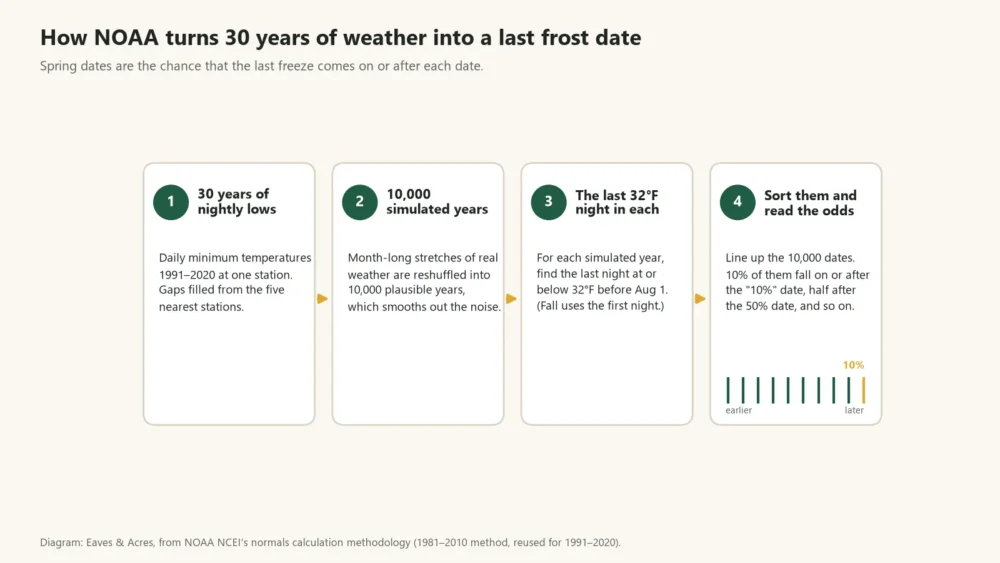
The dates are conditional: they describe years in which a freeze happens at all, which matters in mild climates (below).2
How accurate are last frost dates? We checked
We took every airport station in the lower 48 states where a 32°F night comes in at least 90% of years, read its daily lows from NOAA’s GHCN-Daily archive,4 and found the last freeze of each spring from 1991 to 2026, dropping springs with more than 5% of days missing.
| NOAA date | NOAA’s chance of a later freeze | Actual, 1991–2020 | Actual, 2021–2026 | 1991–2020, 31°F or colder only | 2021–2026, 31°F or colder only |
|---|---|---|---|---|---|
| 90% date | 90% | 92.2% | 92.0% | 86.8% | 87.4% |
| 70% date | 70% | 74.9% | 73.3% | 65.3% | 64.3% |
| 50% date | 50% | 56.0% | 51.7% | 45.4% | 42.1% |
| 30% date | 30% | 35.4% | 30.6% | 26.2% | 22.5% |
| 10% date | 10% | 12.9% | 8.9% | 8.1% | 5.6% |
These stations record whole degrees, so a night at exactly 32°F decides many springs. Counting it as a freeze, 56% of springs from 1991 to 2020 froze on or after the 50% date and 13% after the 10% date; counting only 31°F or colder, 45% and 8%. NOAA’s stated odds sit between the two; its dates come from adjusted lows and simulated years, not raw readings.
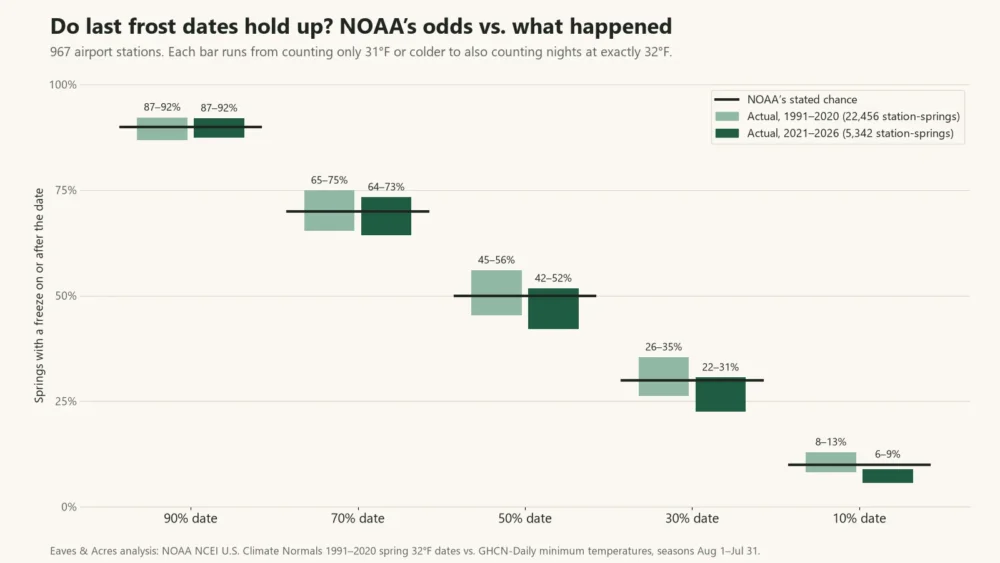
The six springs since 2021 ran a little earlier: 42–52% froze after the 50% date and 6–9% after the 10% date. Six springs are too few to call a trend, but they give no sign the dates are now too early.
Counting 32°F nights, single stations vary more: among 381 stations with 25 or more complete springs, the middle half saw a freeze after the 10% date in 7–17% of springs. Late freezes were usually close: a median 4 days after the 10% date, within 13 days in 9 cases of 10.
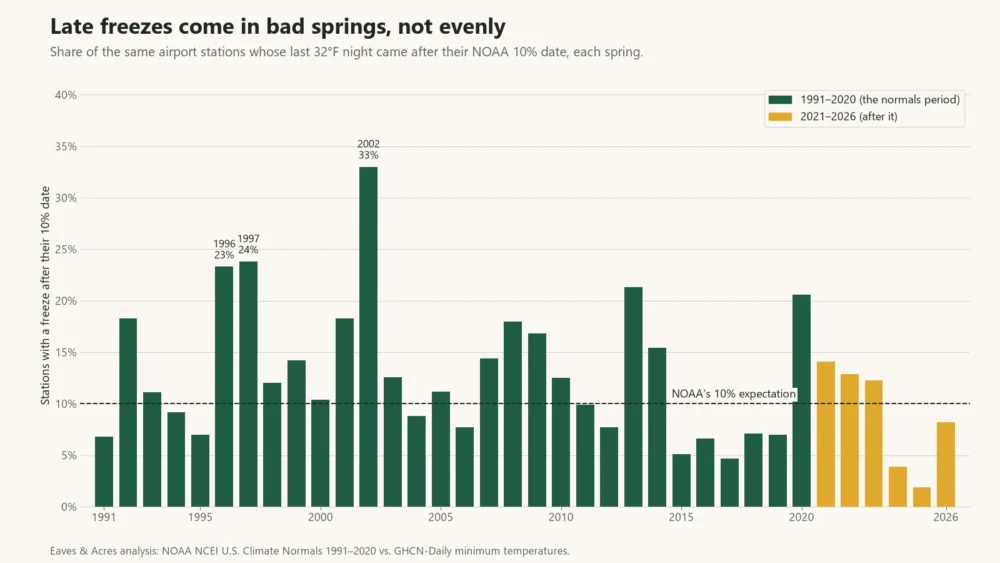
They also come in bunches. In 2002, 33% of the stations froze after their 10% date; in 2025, 2%. “1 in 10” is a long-run rate for one place, not a promise for this spring: from 2021 to 2026, 43% of the stations with all six springs on record had at least one freeze after their 10% date.
What the date means where it rarely freezes
Tampa, Florida: a conditional last frost date
- Scenario
- At Tampa International Airport a 32°F night comes in 34.5% of years. NOAA’s 50% last-freeze date is Jan 20; its 10% date is Feb 10.
- Math
- Chance of a freeze after Jan 20: 34.5% × 50% = about 17%. After Feb 10: 34.5% × 10% = about 3.5%.
- Answer
- Tampa’s “average” date carries about a 1-in-6 chance of a later freeze, not 1 in 2, because most winters there never freeze.
That is why our lookup shows how often frost occurs instead of a date for 1,557 ZIP codes, 689 of them in Florida, where the nearest station freezes in fewer than half of years.
Why your yard can differ from the station
Each date belongs to one station, often an airport or a volunteer observer’s backyard. Cold air drains downhill and pools in low spots on clear, calm nights.
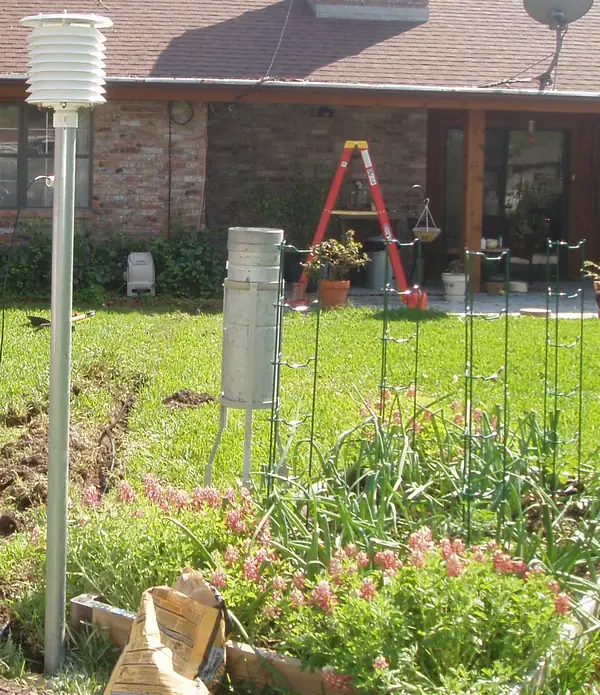
Minimum temperatures can vary 10°F or higher over a short distance
Airport sites are flat and open, unlike most gardens, UC ANR’s Master Gardeners note.6 Plan a few days later for a frost pocket.
Which date to plan around
- Tender transplants (tomatoes, peppers, basil): the 10% date, which the University of Maryland Extension calls the “safer” planting date.10 Our tomato guide explains why warm nights matter too.
- Frost-tolerant crops (peas, spinach, lettuce, onions): before the last frost date, as the Almanac’s list shows.5
- Seed starting: count back from your plant-out date; see our seed-starting guide.
In planting week the forecast wins; see when to cover plants. A planting zone won’t give you these dates.
Find your own four dates
Enter your ZIP code in the frost dates lookup for your four dates and the station behind them; the methodology page lists every rule.
Frequently asked questions
Yes. After the 50% (median) date a freeze still comes in about half of springs; after the 10% date, in about one in ten.
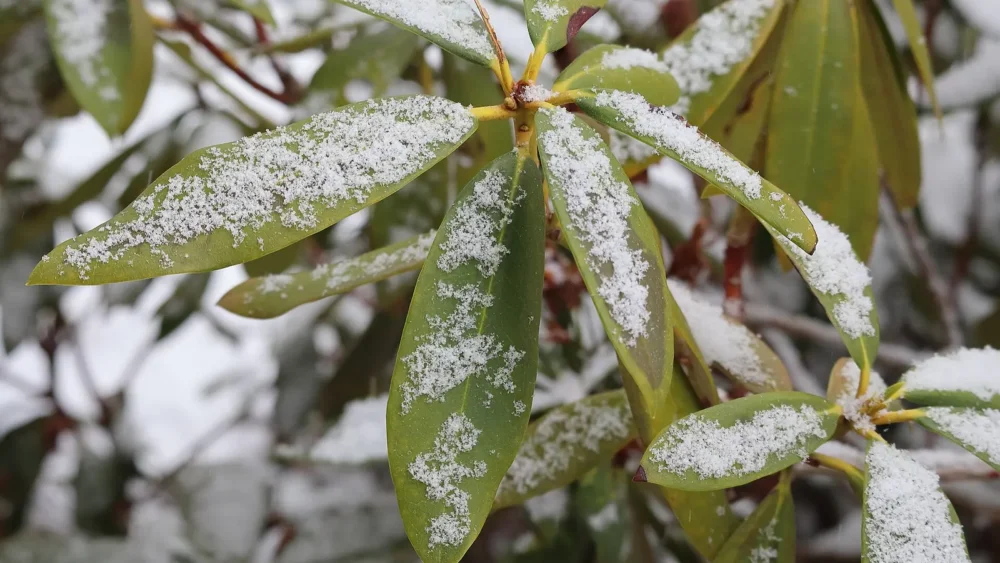
Frost forms when the ground and plants cool to 32°F or below, and they can get there while the air at thermometer height is warmer. The National Weather Service says frost frequently occurs with a thermometer reading in the mid-30s. NOAA’s last frost dates count 32°F air readings.
Usually it is the median, the 50% date. Many sites call that the average, but some use other odds: the Old Farmer’s Almanac says its dates use a 30% threshold.
From 30 years of a station’s daily lows, NOAA builds 10,000 simulated years and finds each one’s last 32°F spring night. One in ten of those nights falls on or after the 10% date.
Close to their stated odds over the long run. At 967 airport stations, 42–52% of springs from 2021 to 2026 froze on or after NOAA’s 50% date and 6–9% after its 10% date. Single stations and single springs vary much more.
It depends on the town. Jacksonville’s airport freezes almost every winter; its 50% last-freeze date is Feb 25 and its 10% date Mar 19. In much of central and south Florida a freeze comes in fewer than half of years, so our lookup shows how often frost occurs instead.
Frost-tolerant crops. The Old Farmer’s Almanac lists peas, spinach, radishes, carrots, onions and lettuce. Wait for the 10% date for tomatoes, peppers and basil.
Sources
- 1.U.S. Climate Normals 1991–2020. NOAA National Centers for Environmental Information, 2021. Used for: spring 32°F dates at 10–90% odds and freeze occurrence for every station used here Back to text
- 2.Normals Calculation Methodology 2020 (with the 1981–2010 supplemental normals report). NOAA National Centers for Environmental Information, 2021. Used for: how frost-freeze probability dates are computed: gap filling, 10,000 bootstrapped years, “on or after”, conditional dates, Aug 1–Jul 31 year Back to text
- 3.Annual/Seasonal Normals Documentation 1991–2020. NOAA National Centers for Environmental Information, 2021. Used for: field definitions (spring dates labeled “or earlier”) Back to text
- 4.Global Historical Climatology Network – Daily (GHCN-Daily). NOAA National Centers for Environmental Information, 2026. Used for: daily minimum temperatures 1990–2026 used to test the dates Back to text
- 5.First and Last Frost Dates by ZIP Code. The Old Farmer’s Almanac, 2026. Used for: “average” date based on a 30% probability threshold; crops to plant before the last frost Back to text
- 6.Ask a Master Gardener – Last Frost Date. UC Agriculture and Natural Resources, The Coastal Gardener (Lisa Nedlan; answer by Master Gardener Terry A.), 2026. Used for: “less than about a 5% chance”; airport data vs. gardens Back to text
- 7.Understanding Frost Dates. Garden Safe, n.d. Used for: “average” date with a 10 percent chance of a later frost Back to text
- 8.What the Last Frost Date Means for Your Garden. Sunnyside Gardens, 2024. Used for: “average” date described as safe for warm-season planting Back to text
- 9.Missouri Frost/Freeze Probabilities Guide. University of Missouri Integrated Pest Management, 2023. Used for: median date = 50% chance; minimum temperatures vary 10°F or more over short distances Back to text
- 10.Spring Frost or Freeze Dates in Maryland. University of Maryland Extension, 2024. Used for: the 10% date as the “safer” planting date Back to text
- 11.NWS Glossary: Frost. National Weather Service, n.d. Used for: frost with thermometer readings in the mid-30s
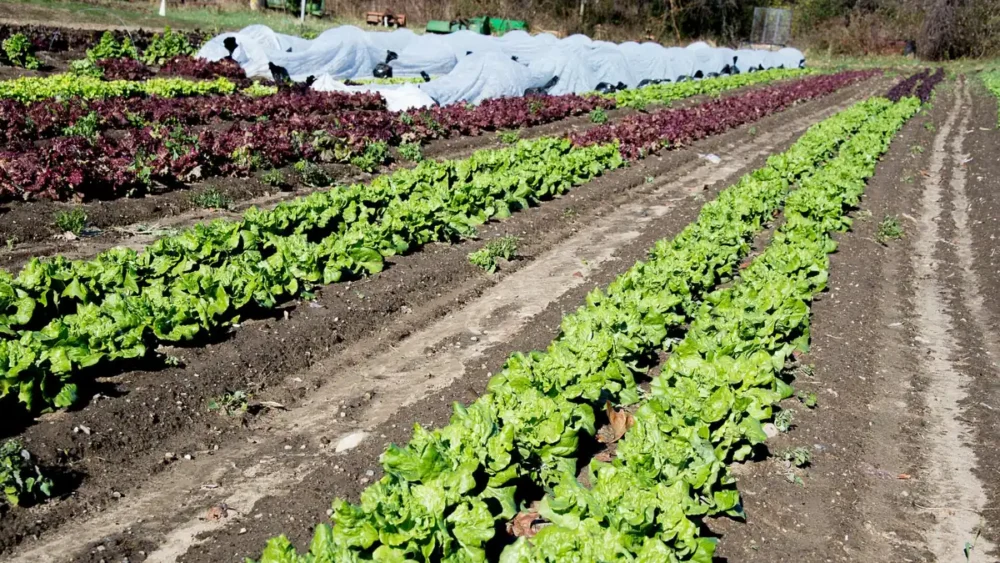
- 12.Photo: Green lettuce after frost, Dwight Sipler (CC BY 2.0). Wikimedia Commons, 2012. Used for: hero photo
- 13.Photo: NWS temperature sensor and rain gauge, Sinton, Texas, NOAA Photo Library (public domain). NOAA via Wikimedia Commons, 2007. Used for: weather station photo
.jpg)

How this guide was made
- Written by the Data & Methodology Desk and reviewed by the Yard & Garden Desk.
- Data: spring 32°F last-freeze dates at 10–90% probability and freeze occurrence from NOAA NCEI U.S. Climate Normals 1991–2020 (annual/seasonal by-station file); actual last-freeze dates 1991–2026 from GHCN-Daily minimum temperatures at 967 first-order (airport) stations in the contiguous US where a 32°F night occurs in at least 90% of years, seasons August 1–July 31, springs with more than 5% of days missing around the dates excluded; ZIP counts from our NOAA nearest-station file. See our methodology.
- AI use: AI tools help us research, draft and check this guide. Every figure is checked against the source cited for it, and calculated figures come from our own code, described on the methodology page.
- Spotted an error? Tell us — the form opens with this page’s address filled in.
Change log
- Oct 7, 2026Re-checked against today’s search results and the cited sources (NOAA NCEI methodology, Almanac, UC ANR, Garden Safe, Sunnyside Gardens, University of Missouri, University of Maryland, National Weather Service). Added a FAQ on frost at temperatures above freezing, from the National Weather Service’s frost definition.
- Oct 4, 2026Published. Definitions and method checked against NOAA NCEI’s normals methodology and 1991–2020 field documentation; source definitions (Almanac, UC ANR, Garden Safe, Sunnyside Gardens, University of Missouri, University of Maryland) read on their live pages; NOAA’s spring 32°F dates tested against GHCN-Daily lows at 967 airport stations, 1991–2026.
Maintains the climate dataset behind every ZIP lookup, documents each tool’s formula, and reviews every guide’s numbers before publication.
Keep reading
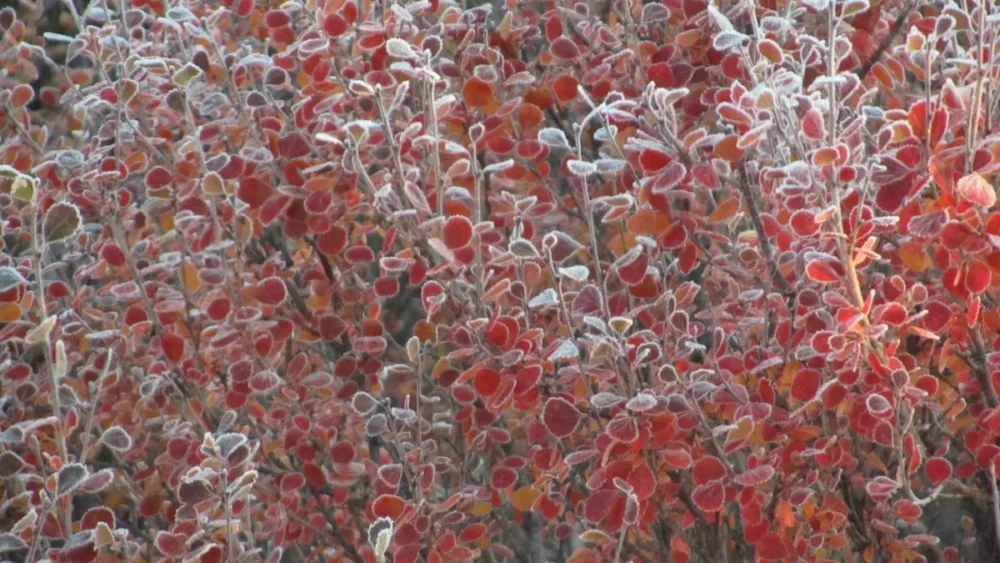
Frost vs. Freeze: What Each Means, the NWS Alerts and Your Growing Season
Frost is ice on surfaces; a freeze is air at 32°F or colder. NWS alerts explained, and NOAA data on how each threshold changes your growing season.
When to Cover Plants for Frost: Temperatures, Timing and City Dates
Cover tender plants at 36°F on clear, calm nights and always at 32°F; below about 28°F covers stop working. Thresholds, NWS alerts, how to cover, and fall frost dates for 24 cities.
2023 USDA Hardiness Zone Map Changes: Did Your Zone Change, and Why?
What changed on the 2023 USDA hardiness zone map and why, with the 2012-to-2023 change for 39,899 ZIP codes by state and city.
Seasonal reminders for your ZIP
Get a short email when it’s time to overseed, start seeds, open the pool or service your furnace — timed to your climate.