2023 USDA Hardiness Zone Map Changes: Did Your Zone Change, and Why?
USDA’s 2023 map uses newer winters, more weather stations and better mapping. We compared PRISM’s official 2012 and 2023 data for every ZIP code to show whose zone moved, by how much, and what it means for your plants.
- Last reviewed Oct 7, 2026
- 11 cited sources
- 11 min read
Set your ZIP to see dates for your area.
- 1The 2023 USDA map averages the coldest night of each winter from 1991 to 2020; the 2012 map used 1976 to 2005. It also uses about 13,400 stations instead of 7,983.
- 2The new map runs about 2.5°F, or a quarter zone, warmer on average. Our check of PRISM’s grids gives 2.53°F.
- 3Of 39,899 ZIP codes, 56% moved one half zone warmer, 1.3% a full zone or more, 42% stayed the same and 1% got colder.
- 4Only 31% got a new zone number, the one plant tags use. A move from 6a to 6b keeps you in zone 6.
- 5The District of Columbia (271 of 271 ZIP codes), Delaware and Tennessee shifted most; North Dakota, California and Iowa least.
- 6USDA says zone changes are not reliable evidence of climate change, and a new zone is no reason to remove healthy plants.
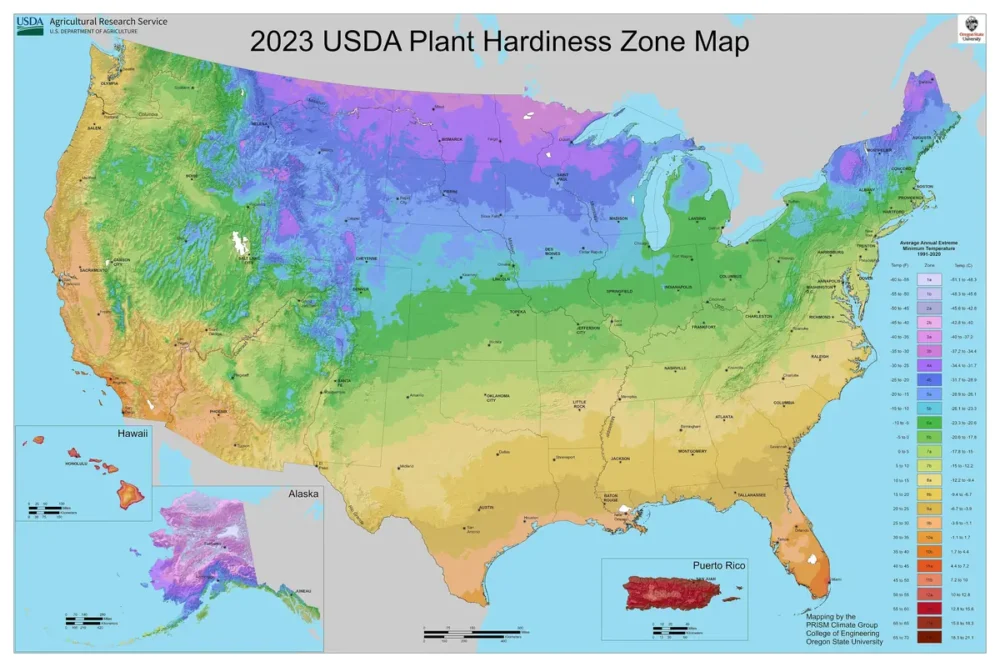
The 2023 USDA Plant Hardiness Zone Map replaced the 2012 map in November 2023. It averages the coldest night of each winter from 1991 to 2020 instead of 1976 to 2005, uses far more weather stations and better mapping, and runs about 2.5°F warmer across the lower 48 states. About half the country moved one half zone warmer; the other half stayed put.1,2
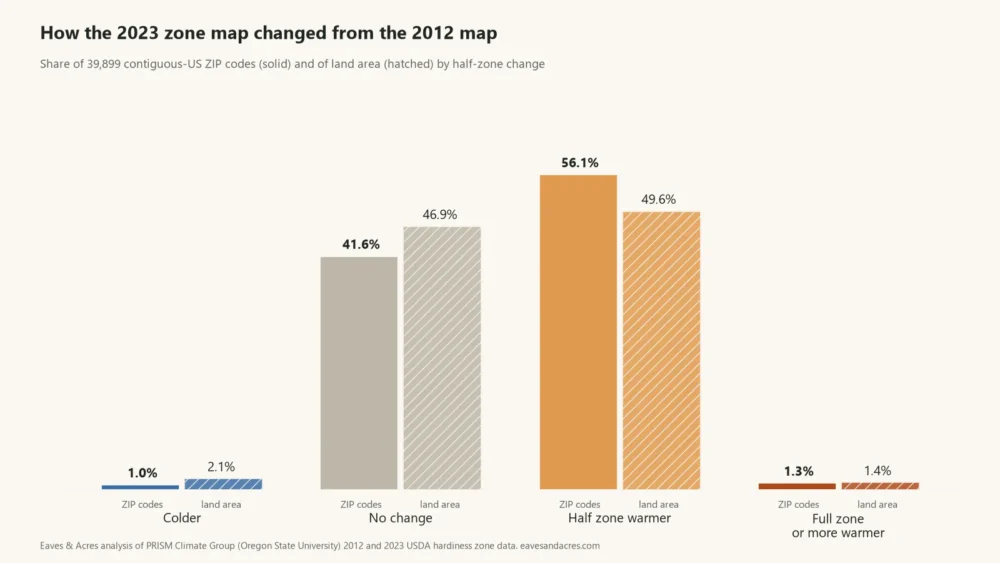
We compared PRISM Climate Group’s official 2012 and 2023 ZIP-code tables for 39,899 ZIP codes: 56% moved a half zone warmer, 1.3% a full zone or more, 42% stayed the same and 1% got colder. Only 31% ended up with a new zone number, the number most plant tags use.5,6
What changed on the 2023 map
The zones still mean the same thing. Each zone is a 10°F band of the average annual extreme minimum temperature, the coldest night of a typical winter, and the “a” and “b” halves split it into 5°F steps.3 What changed is the data and the mapmaking behind them:
| Feature | 2012 map | 2023 map |
|---|---|---|
| Winters averaged | 1976–2005 | 1991–2020 |
| Weather stations | 7,983 | 13,412 (USDA’s map-creation page gives 13,625) |
| Grid, lower 48 states | About half a mile | About half a mile |
| Grid, Alaska | 6¼ square miles | ¼ square mile |
| Zones | 1 to 13 (12 and 13 only in Hawaii and Puerto Rico) | 1 to 13, same |
| Change, lower 48 average | – | About a quarter zone (2.5°F) warmer |
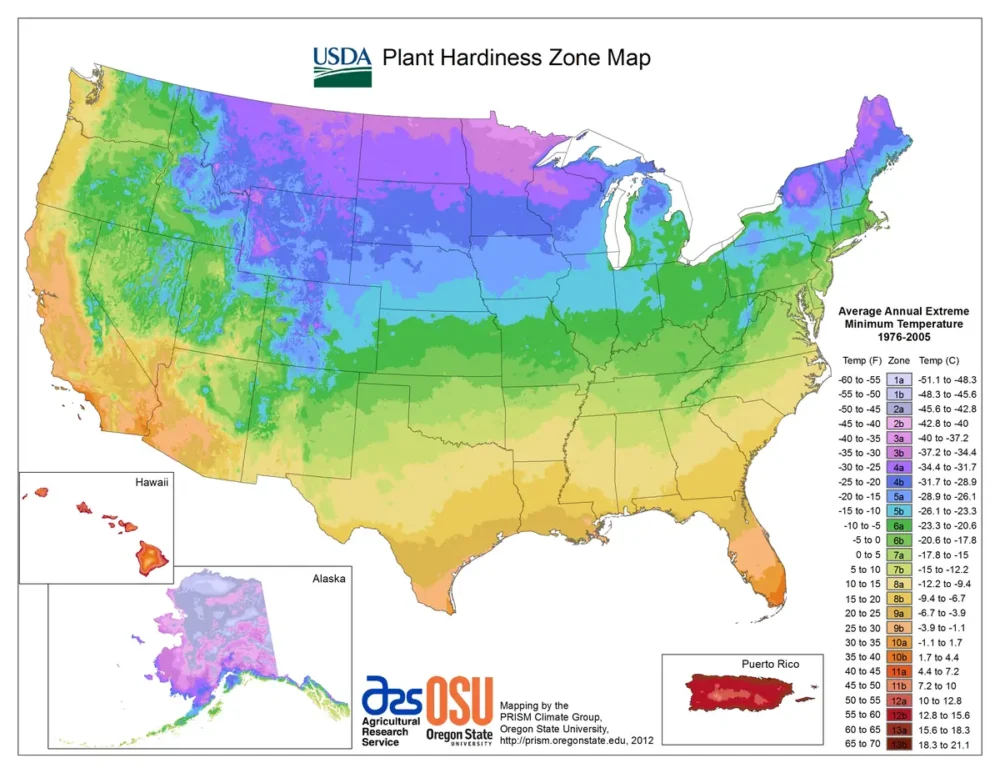
Sources: USDA’s 2023 announcement,1 its map-creation notes2 and PRISM’s data pages.5,6 One common claim is wrong: zones 12 and 13 are not new. USDA says the 2012 map already had 13 zones, and its legend runs to 13b.1,2 The 2023 website did add a “Tips for Growers” section.1 USDA’s first zone map came out in 1960; the 1990 edition drew on 1974–1986 weather and 2012 brought the first 30-year, computer-mapped version.2,7 The 1991–2020 period also matches the baseline climate “normals” climatologists use today.2
How much warmer is the new map?
USDA puts the new map at “about one quarter-zone warmer” than the 2012 map throughout much of the country,2 and Chris Daly, who directs the PRISM Climate Group that mapped both editions, put the lower-48 average at about 2.5°F.7,8 We checked that against PRISM’s own grids, which hold the mapped temperature for every half-mile cell. Averaged over the land area of the lower 48, the coldest winter night is 2.53°F warmer on the 2023 map. It is warmer on 92% of the land and colder on 8%, about half of that by less than a degree.
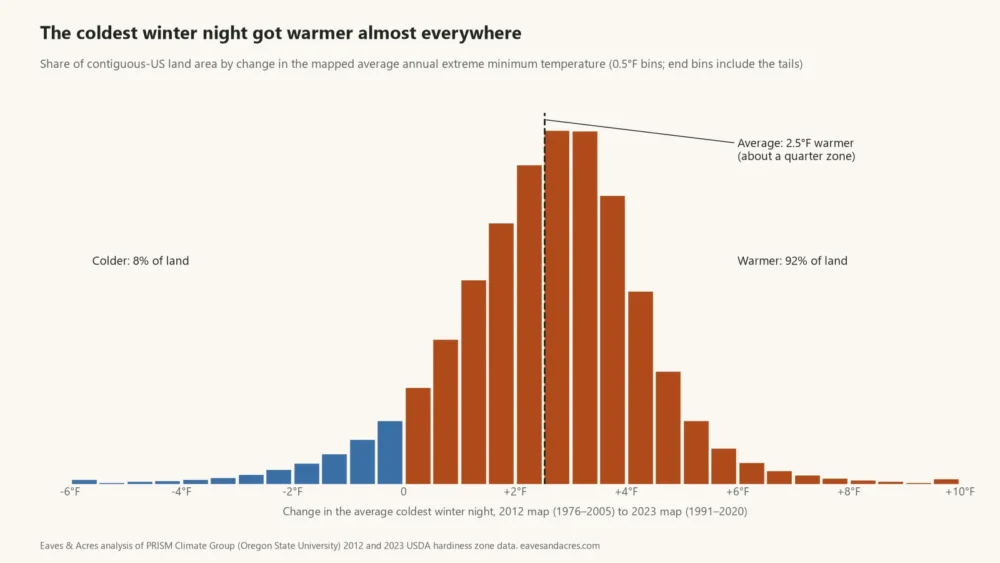
Most places warmed by less than 5°F, so the zone label moved only where the old value sat near the top of its half zone. USDA notes that some places warmed by up to 5°F without moving at all.1 At 43% of the ZIP codes that kept their half zone, the coldest night still rose by more than 2.5°F at the ZIP code’s location.
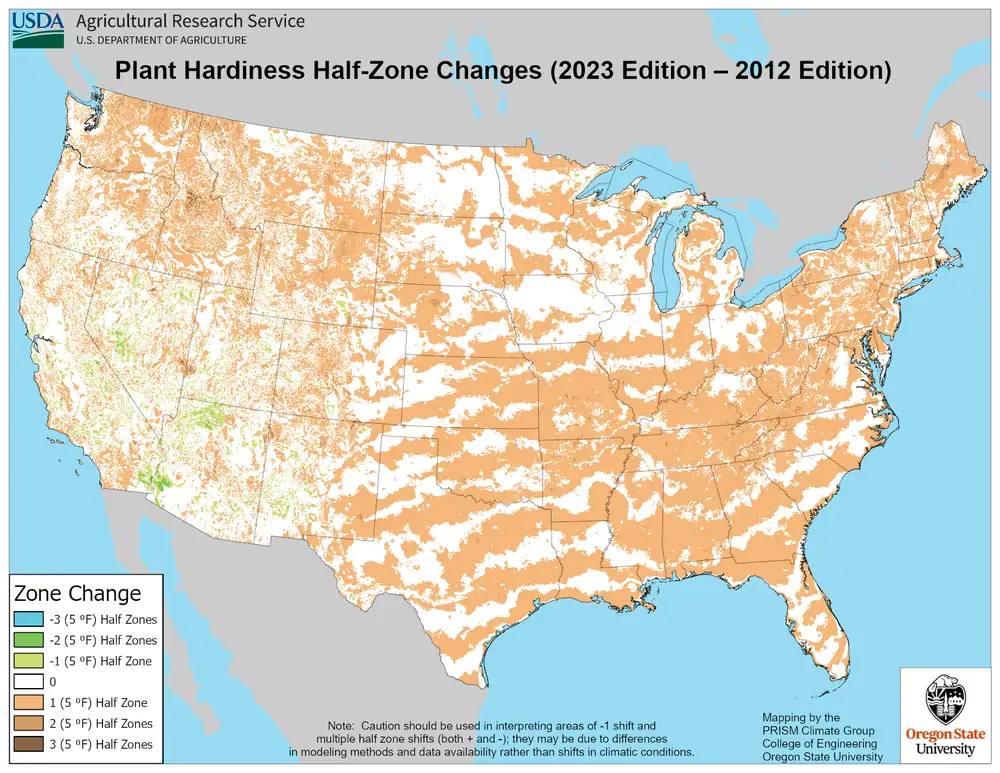
Did your zone change? What 39,899 ZIP codes show
PRISM publishes a zone for every ZIP code for both maps.5,6 We lined up the 39,899 contiguous-US ZIP codes that appear in both tables. ZIP codes crowd into towns and cities, so the share of ZIP codes that warmed (57%) is higher than the share of land (51%).
| Change | ZIP codes | Share of ZIP codes | Share of land area |
|---|---|---|---|
| Colder (one half zone or more) | 396 | 1.0% | 2.1% |
| No change | 16,589 | 41.6% | 46.9% |
| One half zone warmer | 22,396 | 56.1% | 49.6% |
| A full zone or more warmer | 518 | 1.3% | 1.4% |
| Total | 39,899 | 100% | 100% |
A half zone isn’t always a new number on the plant tag
Plant tags and catalogs often give a range of whole zones, such as hydrangea in zones 3–9 in NPR’s example.9 Moving from 6a to 6b keeps you in zone 6, so the same tags still apply. Moving from 6b to 7a puts you in zone 7. Of all ZIP codes, 27% made the first kind of move and 29% the second; counting full-zone jumps, the whole zone number changed for 31%.
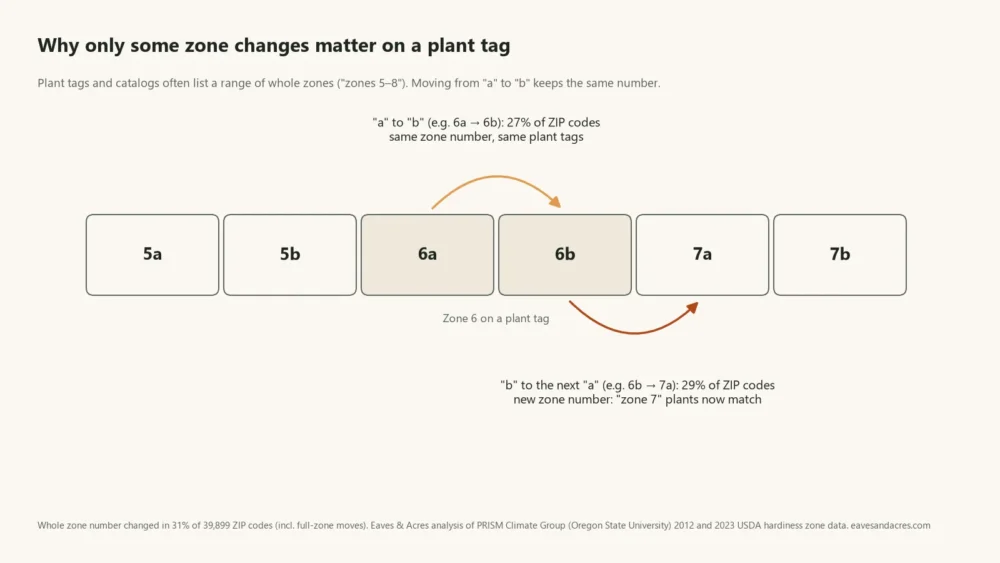
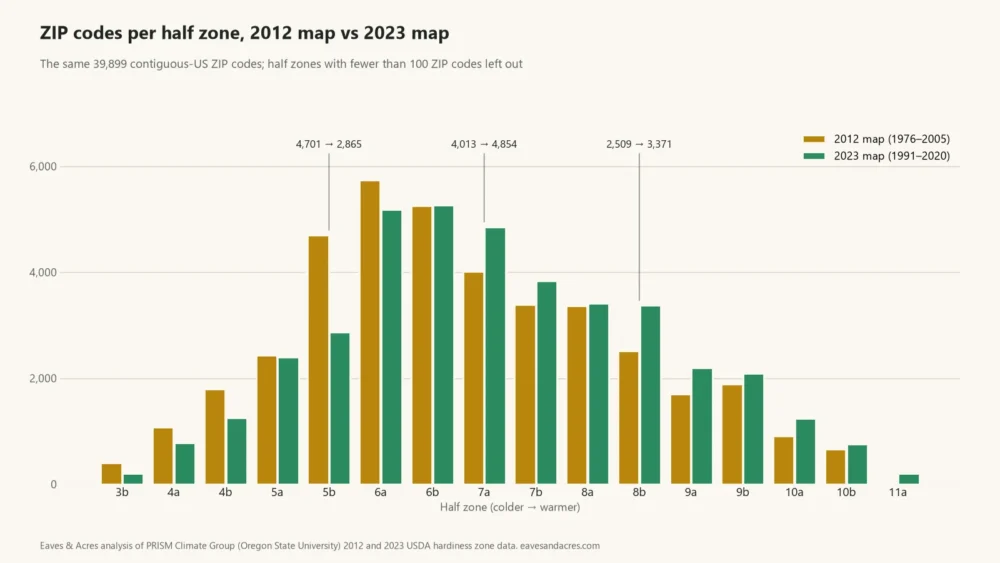
The most common moves were 6b to 7a (3,381 ZIP codes), 6a to 6b (3,366) and 5b to 6a (2,858). Zone 5b lost the most ground: it held 4,701 ZIP codes on the 2012 map and 2,865 on the 2023 map.
Hardiness zone changes by state
The shift was largest in the middle and east of the country and smallest in the West and the northern Plains. That matches Daly’s description of the most change in the Central Plains and Midwest and the least in the Southwest.7
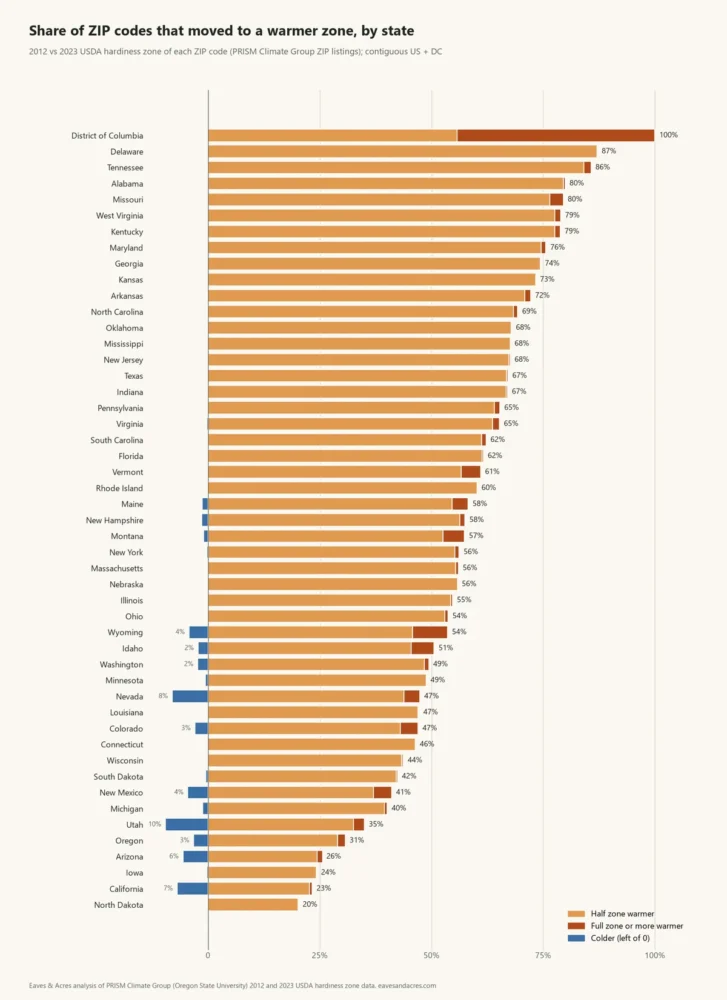
- Most change: every one of the District of Columbia’s 271 ZIP codes moved warmer, and 120 of them jumped a full zone, from 7a to 8a. Delaware (87%), Tennessee (86%), Alabama and Missouri (both 80%) follow.
- Least change: North Dakota (20%), California (23%), Iowa (24%) and Arizona (26%).
- Colder: 396 ZIP codes moved to a colder zone, 175 of them in California (clusters around Santa Rosa and Petaluma and in Orange County), with many of the rest in Utah, Arizona, Nevada, New Mexico and Colorado.
No state has a single zone. North Carolina’s ZIP codes run 6b to 9a on the 2023 map, most often 8a; Texas runs 6b to 10b (most often 8b) and Arizona 5b to 10a (most often 9b), because elevation matters as much as latitude. The last column of Table 4 gives every state’s range; look up your own ZIP code for your zone.
| State | ZIP codes | Half zone warmer | Full zone or more warmer | No change | Colder | Average coldest-night change | 2023 zones (most common) |
|---|---|---|---|---|---|---|---|
| Alabama | 804 | 80% | 0% | 20% | 0% | +3.8°F | 7b–9b (8b) |
| Arizona | 521 | 24% | 1% | 69% | 6% | +0.9°F | 5b–10a (9b) |
| Arkansas | 691 | 71% | 1% | 28% | 0% | +3.6°F | 7a–8b (8a) |
| California | 2,553 | 23% | 1% | 70% | 7% | +0.7°F | 5b–11a (9b) |
| Colorado | 625 | 43% | 4% | 50% | 3% | +2.0°F | 4a–7a (6a) |
| Connecticut | 418 | 46% | 0% | 54% | 0% | +2.9°F | 6a–7b (6b) |
| Delaware | 93 | 87% | 0% | 13% | 0% | +3.3°F | 7a–8a (7b) |
| District of Columbia | 271 | 56% | 44% | 0% | 0% | +6.2°F | 7b–8a (8a) |
| Florida | 1,454 | 61% | 0% | 38% | 0% | +3.0°F | 8b–11b (10a) |
| Georgia | 937 | 74% | 0% | 26% | 0% | +3.8°F | 7a–9a (8a) |
| Idaho | 312 | 46% | 5% | 47% | 2% | +3.2°F | 4a–7b (6b) |
| Illinois | 1,544 | 54% | 0% | 45% | 0% | +2.7°F | 5a–7a (6a) |
| Indiana | 928 | 67% | 0% | 33% | 0% | +3.2°F | 5b–7a (6a) |
| Iowa | 1,042 | 24% | 0% | 75% | 0% | +1.4°F | 4b–6a (5a) |
| Kansas | 741 | 73% | 0% | 27% | 0% | +3.4°F | 6a–7a (6b) |
| Kentucky | 933 | 78% | 1% | 21% | 0% | +4.2°F | 6b–7b (7a) |
| Louisiana | 710 | 47% | 0% | 53% | 0% | +3.0°F | 8b–10a (9a) |
| Maine | 478 | 55% | 4% | 41% | 1% | +3.0°F | 3b–7a (5a) |
| Maryland | 599 | 75% | 1% | 24% | 0% | +3.9°F | 6a–8a (7b) |
| Massachusetts | 675 | 55% | 1% | 44% | 0% | +2.6°F | 5b–7b (6b) |
| Michigan | 1,154 | 40% | 1% | 59% | 1% | +2.2°F | 4a–7a (6a) |
| Minnesota | 942 | 49% | 0% | 50% | 1% | +2.3°F | 3a–5a (4b) |
| Mississippi | 524 | 68% | 0% | 32% | 0% | +3.3°F | 7b–9a (8b) |
| Missouri | 1,144 | 76% | 3% | 20% | 0% | +4.3°F | 5b–8a (6b) |
| Montana | 399 | 53% | 5% | 42% | 1% | +2.5°F | 3b–6b (4b) |
| Nebraska | 609 | 56% | 0% | 44% | 0% | +2.9°F | 5a–6a (5b) |
| Nevada | 249 | 44% | 4% | 45% | 8% | +1.8°F | 5a–10a (9b) |
| New Hampshire | 280 | 56% | 1% | 41% | 1% | +3.1°F | 4a–6b (6a) |
| New Jersey | 715 | 67% | 0% | 32% | 0% | +3.5°F | 6b–8a (7a) |
| New Mexico | 419 | 37% | 4% | 54% | 4% | +1.9°F | 5a–8b (7b) |
| New York | 2,124 | 55% | 1% | 44% | 0% | +3.0°F | 4a–7b (6a) |
| North Carolina | 1,072 | 68% | 1% | 31% | 0% | +3.4°F | 6b–9a (8a) |
| North Dakota | 405 | 20% | 0% | 80% | 0% | +1.6°F | 3b–4b (4a) |
| Ohio | 1,391 | 53% | 1% | 46% | 0% | +3.2°F | 6a–7a (6b) |
| Oklahoma | 760 | 68% | 0% | 32% | 0% | +3.6°F | 6b–8a (7b) |
| Oregon | 473 | 29% | 2% | 66% | 3% | +1.9°F | 5b–9b (8b) |
| Pennsylvania | 2,108 | 64% | 1% | 35% | 0% | +3.5°F | 5b–8a (6b) |
| Rhode Island | 88 | 60% | 0% | 40% | 0% | +2.7°F | 6b–7b (7a) |
| South Carolina | 526 | 61% | 1% | 38% | 0% | +3.3°F | 8a–9b (8b) |
| South Dakota | 382 | 42% | 0% | 57% | 0% | +1.8°F | 4a–5b (4b) |
| Tennessee | 774 | 84% | 2% | 14% | 0% | +4.4°F | 6b–8a (7b) |
| Texas | 2,568 | 67% | 0% | 33% | 0% | +3.4°F | 6b–10b (8b) |
| Utah | 337 | 33% | 2% | 56% | 10% | +1.4°F | 4a–8b (6a) |
| Vermont | 305 | 57% | 4% | 39% | 0% | +3.6°F | 4a–6a (5a) |
| Virginia | 1,197 | 64% | 2% | 35% | 0% | +3.5°F | 6a–8b (7b) |
| Washington | 708 | 48% | 1% | 48% | 2% | +2.8°F | 6a–9b (8b) |
| West Virginia | 843 | 78% | 1% | 21% | 0% | +3.9°F | 5b–7a (7a) |
| Wisconsin | 872 | 43% | 0% | 56% | 0% | +2.1°F | 3b–6a (5b) |
| Wyoming | 192 | 46% | 8% | 42% | 4% | +2.4°F | 4a–5b (5a) |
Zone changes in 20 large cities
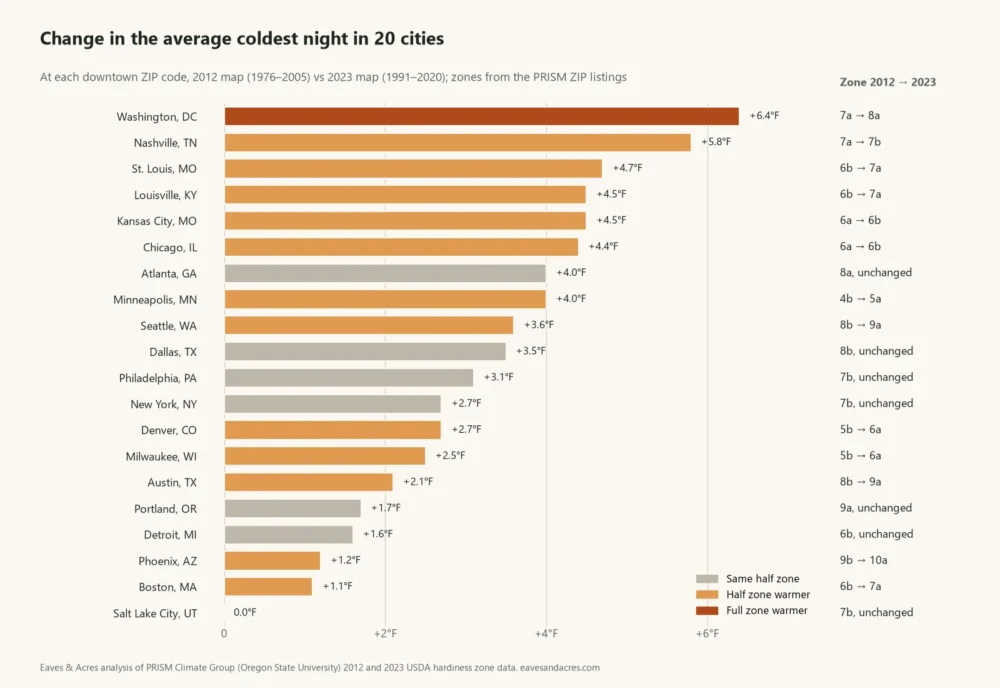
Downtown ZIP codes show how uneven the change was. Atlanta’s coldest night rose 4.0°F and it stayed 8a; Boston’s rose 1.1°F and it moved from 6b to 7a because it sat right at the line. Hot Springs, Arkansas, moved from 7b to 8a, as NPR reported for a gardener there.8
| City (ZIP) | 2012 zone | 2023 zone | Coldest-night change | 2023 average coldest night |
|---|---|---|---|---|
| Atlanta, GA (30303) | 8a | 8a | +4.0°F | 14°F |
| Austin, TX (78701) | 8b | 9a | +2.1°F | 22°F |
| Boston, MA (02108) | 6b | 7a | +1.1°F | 1°F |
| Chicago, IL (60601) | 6a | 6b | +4.4°F | -4°F |
| Dallas, TX (75201) | 8b | 8b | +3.5°F | 19°F |
| Denver, CO (80202) | 5b | 6a | +2.7°F | -8°F |
| Detroit, MI (48226) | 6b | 6b | +1.6°F | -2°F |
| Kansas City, MO (64105) | 6a | 6b | +4.5°F | 0°F |
| Louisville, KY (40202) | 6b | 7a | +4.5°F | 4°F |
| Milwaukee, WI (53202) | 5b | 6a | +2.5°F | -8°F |
| Minneapolis, MN (55401) | 4b | 5a | +4.0°F | -17°F |
| Nashville, TN (37201) | 7a | 7b | +5.8°F | 8°F |
| New York, NY (10001) | 7b | 7b | +2.7°F | 8°F |
| Philadelphia, PA (19103) | 7b | 7b | +3.1°F | 9°F |
| Phoenix, AZ (85004) | 9b | 10a | +1.2°F | 31°F |
| Portland, OR (97204) | 9a | 9a | +1.7°F | 22°F |
| Salt Lake City, UT (84101) | 7b | 7b | 0.0°F | 6°F |
| Seattle, WA (98101) | 8b | 9a | +3.6°F | 22°F |
| St. Louis, MO (63101) | 6b | 7a | +4.7°F | 1°F |
| Washington, DC (20001) | 7a | 8a | +6.4°F | 11°F |
Why zones changed: newer winters, more stations, better maps
USDA gives three reasons.1,2 Most of the change comes from the newer 30-year period. The rest comes from data from more stations and from improved interpolation, which helps most in mountain areas.2,7 In Alaska, the new map is warmer mainly because it uses more data from mountain slopes that sit above cold valley air.1,2 Better methods can also make a zone colder, and USDA’s change map carries a warning that −1 and multi-half-zone shifts “may be due to differences in modeling methods and data availability.”4
USDA also cautions against reading the map as a climate record:
changes in zones are not reliable evidence of whether there has been global warming
The reason is the statistic: one coldest night per winter swings a lot from year to year, while climate trends are judged on average temperatures over 50 to 100 years.2 That doesn’t mean winters didn’t warm. Climate Central, using station records and its own method, found that the average annual minimum temperature, the same coldest-night statistic, had warmed at 231 of 242 US locations compared with 1951–1980.10 Daly told NPR he expects zones to keep moving slowly northward over the long run.8
What a new zone means for your garden
Not much, day to day. USDA says a changed zone is no reason to remove plants or change what you grow, because what has thrived will most likely keep thriving.3 A USDA horticulturist who worked on the map put it more bluntly:
nowhere in the country where people should be significantly changing the way they garden
- Your zone is an average, not the floor. A plant rated exactly for your new zone can still die in a rare cold snap.3 NPR’s analysis found St. Louis, now 7a, dropped below its zone in at least 11 of the 30 winters, reaching −10°F in 2014.9
- Edge-of-zone plants are still a gamble. If your ZIP code moved from 6b to 7a, “zone 7” plants now match your tag, but you are at the cold edge of their range. A sheltered spot by a south-facing wall, or mulch, can help.3,7
- The map still measures only winter cold. USDA lists wind, soil type, soil moisture, humidity, pollution, snow, winter sun and summer heat as other factors in whether a plant survives, and none of them is in the zone.3
- Look backward, not forward. Daly’s point is that the new map describes winters already past:
we’re telling you what’s already happened
A zone also never set your planting dates. It says nothing about spring or fall frost; see our guide to planting zone vs. frost date. Garlic timing follows your first fall frost, and tulips need enough cool weeks, which a zone doesn’t measure either (when to plant tulip bulbs). For spring, start from what a last frost date really means, and count seed-starting weeks from it, not from a zone chart (when to start seeds indoors). Zone charts for winter sowing miss too: what counts there is the number of cold nights left, and Seattle (9a) averages 125 a winter while Dallas (8b) has 48.
How to check your old and new zone
- New zone: enter your ZIP code on the USDA Plant Hardiness Zone Map, the official source. Our frost dates by ZIP code lookup shows the same 2023 zone next to your frost dates, from PRISM’s 2023 table.5
- Old zone: PRISM still publishes the 2012 ZIP-code table on its hardiness zone data page (“Prior Version (2012)”).6 USDA’s map downloads page keeps the 2012 national map and the change map shown above.4
- Compare: one half-zone step is 5°F. If the number changed (6b to 7a), check the zone range on plant tags before buying; if only the letter changed, nothing on the tag changes.
How we compared the 2012 and 2023 maps
We used PRISM Climate Group’s ZIP-code tables for the contiguous US exactly as published (2012 table: 40,534 ZIP codes; 2023: 39,921; in both: 39,899) and counted half-zone steps between them.5,6 Land-area shares and °F changes come from PRISM’s two temperature grids (12.1 million cells, weighted by area). States come from our ZIP file. A ZIP code’s share is not a share of land or of people. These are counts and charts, not a new map: the official zones remain USDA’s. Full rules are on our methodology page.
Next step
Look up your 2023 zone with USDA, then check whether only the letter or the number changed. For timing, use your frost dates, not your zone. More on what zones can and can’t do is in our hardiness zone guides.
Frequently asked questions
Yes. USDA released a new map on November 15, 2023, the first since 2012. About half the country moved one half zone warmer and the rest stayed the same.
No. The 2023 map is still the current edition. When we checked on October 7, 2026, USDA’s map site served the 2023 map, and PRISM, which made it, listed 2023 as the current version. USDA published its first map in 1960 and revised it in 1990, 2012 and 2023.
Enter your ZIP code on USDA’s map for the 2023 zone, then find the same ZIP code in PRISM’s 2012 ZIP-code table. Each half-zone step is 5°F.
It can’t be proven from the map. USDA says zone changes are not reliable evidence of global warming. Newer winters explain most of the shift, and more stations and better mapping the rest.
No. USDA says what has thrived in your yard will most likely keep thriving. Use the new zone when you choose new perennials.
Often, but carefully. A zone is an average coldest night, not the lowest. St. Louis, now 7a, fell below 7a in at least 11 of the 30 winters, NPR found.
No. The “b” half is 5°F warmer: 5a covers average coldest nights of −20 to −15°F, 5b −15 to −10°F. Likewise 9a is 20 to 25°F and 9b 25 to 30°F.
No. USDA added zones 12 and 13 in the 2012 edition. They appear only in Hawaii and Puerto Rico.
Mostly better data and methods, USDA says. Only 1% of ZIP codes moved colder, 175 of 396 of them in California.
A zone doesn’t measure frost, so the new map didn’t change any frost date. Our frost dates come from NOAA’s 1991–2020 normals, the same years as the new map.
Sources
- 1.USDA Unveils Updated Plant Hardiness Zone Map. USDA Agricultural Research Service, 2023. Used for: release date; 13,412 vs 7,983 stations; Alaska resolution; about half the country one half zone warmer (0–5°F); reasons for the change; climate-change caution; Tips for Growers Back to text
- 2.Map Creation. USDA Agricultural Research Service, 2023. Used for: 1976–2005 vs 1991–2020; about one quarter zone warmer; some zones colder; 13,625 stations; half-mile PRISM grid; zones 12 and 13 added in 2012; climate-change statement; map copyright terms Back to text
- 3.How to Use the Maps. USDA Agricultural Research Service, 2023. Used for: 10°F zones and 5°F half zones; no need to remove plants; average not lowest temperature; microclimates Back to text
- 4.Map Downloads (2023–2012 Difference map). USDA Agricultural Research Service and PRISM Climate Group, 2023. Used for: national half-zone change map and its caution note; 2012 national map Back to text
- 5.2023 USDA Plant Hardiness Zone GIS Datasets (ZIP code listing and grid). PRISM Climate Group, Oregon State University, 2023. Used for: 2023 half zone for 39,921 contiguous-US ZIP codes; 1991–2020 mean annual extreme minimum grid; 2023 listed as the current version Back to text
- 6.2012 USDA Plant Hardiness Zone GIS Datasets (ZIP code listing and grid). PRISM Climate Group, Oregon State University, 2012. Used for: 2012 half zone for 40,534 contiguous-US ZIP codes; 1976–2005 grid Back to text
- 7.Everything You Need to Know About the New Plant Hardiness Zone Map. Brooklyn Botanic Garden (Ellie Shechet, with Chris Daly of PRISM and Todd Rounsaville of USDA), 2024. Used for: 2.5°F lower-48 average; regional pattern; Rounsaville and Daly quotes; mulch and mountain mapping; USDA maps of 1960, 1990, 2012 and 2023 Back to text
- 8.‘It feels like I’m not crazy.’ Gardeners aren’t surprised as USDA updates key map. NPR (Julia Simon), 2023. Used for: Daly on 2.5°F and long-run northward shift; Hot Springs, Arkansas, 7b to 8a Back to text
- 9.The USDA’s gardening zones shifted. This map shows you what’s changed in vivid detail. NPR (Daniel Wood, Connie Hanzhang Jin, Brent Jones, Jeff Brady), 2023. Used for: St. Louis winters below its zone; hydrangea zones 3–9 example Back to text
- 10.Shifting Planting Zones. Climate Central, 2023. Used for: average annual minimum temperatures warmed at 231 of 242 US locations since 1951–1980 Back to text
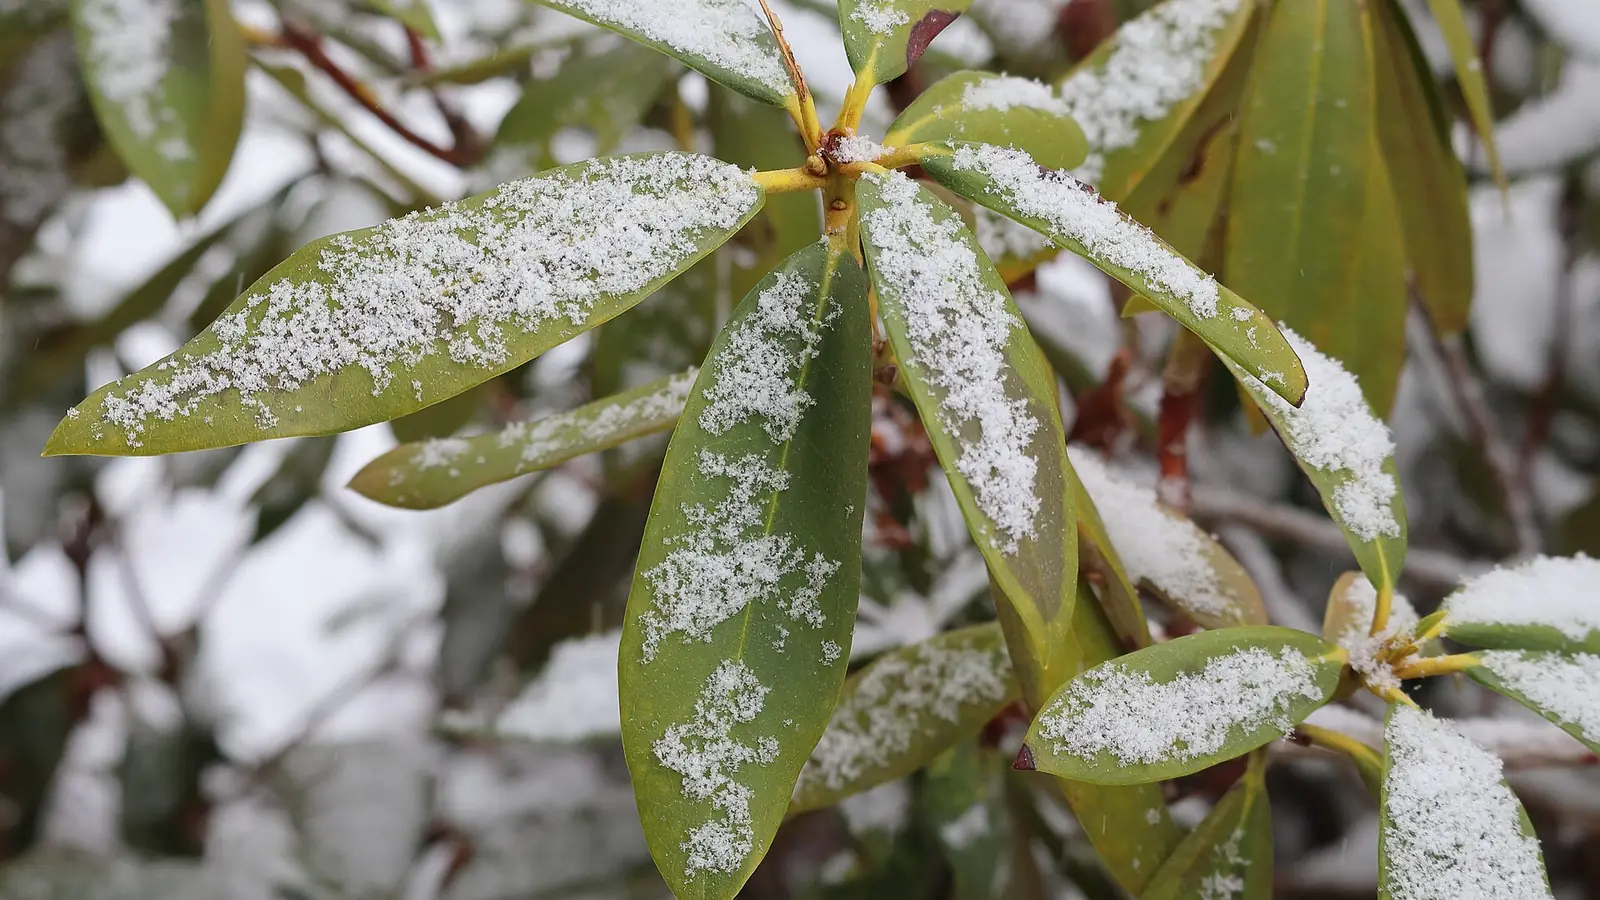
- 11.Photo: Snowflakes on rhododendron leaves, Charlton, MA, Peter Cooper Jr. (CC0). Wikimedia Commons, 2025. Used for: hero photo

How this guide was made
- Written by the Data & Methodology Desk and reviewed by the Yard & Garden Desk.
- Data: 2012 and 2023 USDA hardiness zones for each contiguous-US ZIP code from the PRISM Climate Group’s (Oregon State University) official ZIP-code tables, compared for the 39,899 ZIP codes in both; changes in the average annual extreme minimum temperature from PRISM’s 2012 (1976–2005) and 2023 (1991–2020) grids, weighted by land area; states from our ZIP-code file. Counts and charts only; the official zones remain USDA’s. See our methodology.
- AI use: AI tools help us research, draft and check this guide. Every figure is checked against the source cited for it, and calculated figures come from our own code, described on the methodology page.
- Spotted an error? Tell us — the form opens with this page’s address filled in.
Change log
- Oct 7, 2026Re-checked the USDA ARS announcement, the Map Creation page, PRISM’s data page and the Brooklyn Botanic Garden quotes against the live pages; added an FAQ confirming the 2023 map is still the current edition (no 2025 or 2026 map) and a note that zone charts for winter sowing miss the cold-night deadline.
- Oct 4, 2026Published. What changed and why checked against USDA ARS’s 2023 announcement and the USDA map’s Map Creation, How to Use the Maps and Map Downloads pages; 2012 and 2023 zones compared for 39,899 ZIP codes from the PRISM Climate Group’s official ZIP-code tables, and the change in °F from PRISM’s two grids.
Maintains the climate dataset behind every ZIP lookup, documents each tool’s formula, and reviews every guide’s numbers before publication.
Keep reading
Planting Zone vs Frost Date: What a Hardiness Zone Can and Can’t Tell You
Your zone measures winter’s coldest night; your frost dates time your planting. Across 38,384 ZIP codes, frost dates inside one half-zone still differ by weeks.
What Is a Last Frost Date? What the 10%, 30%, 50% and 90% Odds Mean
A last frost date is a probability, not a deadline. What NOAA’s 10%, 30%, 50% and 90% dates mean, and a test of how often they held up at 967 airport stations.
Frost vs. Freeze: What Each Means, the NWS Alerts and Your Growing Season
Frost is ice on surfaces; a freeze is air at 32°F or colder. NWS alerts explained, and NOAA data on how each threshold changes your growing season.
Seasonal reminders for your ZIP
Get a short email when it’s time to overseed, start seeds, open the pool or service your furnace — timed to your climate.