Frost Dates by ZIP Code: When Is My Last Frost?
Answers: when is my last frost?
Your USDA hardiness zone from the official 2023 ZIP-code table, its average coldest-night range, whether it changed since the 2012 map, and your frost dates side by side.
Zone: PRISM Climate Group, Oregon State University, 2023 USDA Plant Hardiness Zone Map ZIP-code table, shown unaltered (2012 table for the comparison). Frost dates: NOAA station , 1991–2020 normals. This lookup is not the official USDA map; check it at planthardiness.ars.usda.gov.
Your planting zone is the USDA plant hardiness zone for your ZIP code: a label for the average coldest winter night where you live, in 10°F zones split into 5°F half-zones. Enter your ZIP above to see it on the official 2023 map, how it changed from the 2012 map, and the frost dates that actually time your planting.
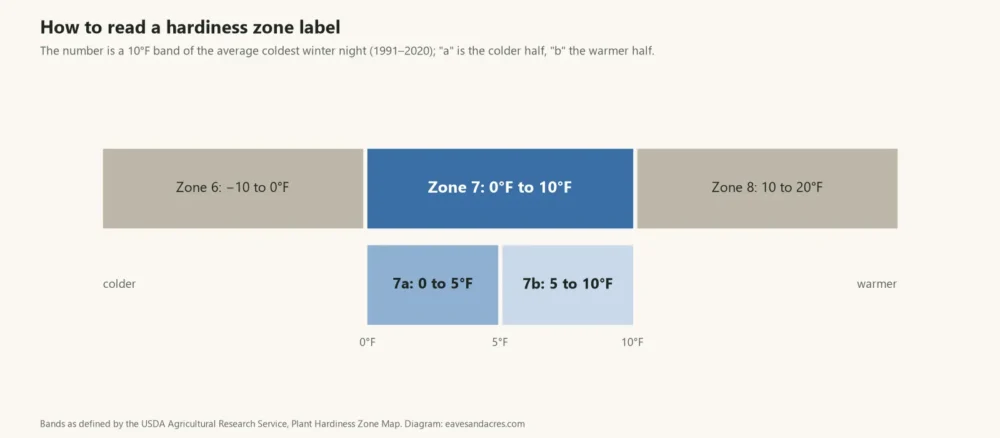
The 2023 USDA Plant Hardiness Zone Map is based on the average annual extreme minimum winter temperature: the single coldest night of each winter, averaged over 1991 to 2020.1 Zone 1 is the coldest and zone 13 the warmest. Each zone covers 10°F and splits into a colder “a” half and a warmer “b” half, so 7a means an average coldest night of 0 to 5°F.1
A zone is an average, not a guarantee. USDA puts it plainly:
They are based on the average lowest temperatures, not the lowest ever.
So a plant rated exactly to your zone can still be lost in a rare cold snap, which is why USDA also points gardeners to local extension services and Master Gardeners.1
| Zone | “a” half | “b” half |
|---|---|---|
| 3 | −40 to −35°F | −35 to −30°F |
| 4 | −30 to −25°F | −25 to −20°F |
| 5 | −20 to −15°F | −15 to −10°F |
| 6 | −10 to −5°F | −5 to 0°F |
| 7 | 0 to 5°F | 5 to 10°F |
| 8 | 10 to 15°F | 15 to 20°F |
| 9 | 20 to 25°F | 25 to 30°F |
| 10 | 30 to 35°F | 35 to 40°F |
| 11 | 40 to 45°F | 45 to 50°F |
The lookup compares your ZIP code with the 2012 edition of the map. Across the 39,899 ZIP codes in both of the PRISM Climate Group’s ZIP-code tables, 41.6% kept the same half-zone, 56.1% moved one half-zone warmer and 1.3% moved two or more half-zones warmer; about 1% moved colder.3 Only 31.0% got a new zone number, because a shift from 6a to 6b keeps the same number.
USDA’s release of the 2023 map describes the same pattern: about half of the country shifted to the next warmer half zone.2 It also warns against reading too much into it:
Temperature updates to plant hardiness zones are not necessarily reflective of global climate change
The reasons it gives are the year-to-year swings in the coldest night, newer mapping methods and data from more weather stations.2 If your zone changed, USDA’s advice is not to start pulling plants: “What has thrived in your yard will most likely continue to thrive.”1 Our guide to the 2023 hardiness zone map changes breaks the shift down by state and city.
Most states span several zones, so a state answer is only a starting point. The table shows the coldest and warmest half-zone among each state’s ZIP codes in PRISM’s 2023 table, the most common one, and the share of ZIP codes that moved warmer since 2012. It counts ZIP codes, not land area, so it leans toward where people live.3
| State | Zone range | Most common zone (share of ZIPs) | ZIPs warmer than 2012 |
|---|---|---|---|
| Alabama | 7b–9b | 8b (42%) | 80% |
| Arizona | 5b–10a | 9b (39%) | 26% |
| Arkansas | 7a–8b | 8a (54%) | 72% |
| California | 5b–11a | 9b (34%) | 23% |
| Colorado | 4a–7a | 6a (44%) | 47% |
| Connecticut | 6a–7b | 6b (60%) | 46% |
| Delaware | 7a–8a | 7b (95%) | 87% |
| District of Columbia | 7b–8a | 8a (86%) | 100% |
| Florida | 8b–11b | 10a (30%) | 62% |
| Georgia | 7a–9a | 8a (41%) | 74% |
| Idaho | 4a–7b | 6b (28%) | 51% |
| Illinois | 5a–7a | 6a (42%) | 55% |
| Indiana | 5b–7a | 6a (61%) | 67% |
| Iowa | 4b–6a | 5a (54%) | 24% |
| Kansas | 6a–7a | 6b (54%) | 73% |
| Kentucky | 6b–7b | 7a (78%) | 79% |
| Louisiana | 8b–10a | 9a (48%) | 47% |
| Maine | 3b–7a | 5a (32%) | 58% |
| Maryland | 6a–8a | 7b (61%) | 76% |
| Massachusetts | 5b–7b | 6b (42%) | 56% |
| Michigan | 4a–7a | 6a (55%) | 40% |
| Minnesota | 3a–5a | 4b (36%) | 49% |
| Mississippi | 7b–9a | 8b (58%) | 68% |
| Missouri | 5b–8a | 6b (46%) | 79% |
| Montana | 3b–6b | 4b (32%) | 57% |
| Nebraska | 5a–6a | 5b (48%) | 56% |
| Nevada | 5a–10a | 9b (24%) | 47% |
| New Hampshire | 4a–6b | 6a (42%) | 58% |
| New Jersey | 6b–8a | 7a (47%) | 68% |
| New Mexico | 5a–8b | 7b (25%) | 41% |
| New York | 4a–7b | 6a (23%) | 56% |
| North Carolina | 6b–9a | 8a (60%) | 69% |
| North Dakota | 3b–4b | 4a (78%) | 20% |
| Ohio | 6a–7a | 6b (56%) | 54% |
| Oklahoma | 6b–8a | 7b (61%) | 68% |
| Oregon | 5b–9b | 8b (40%) | 31% |
| Pennsylvania | 5b–8a | 6b (36%) | 65% |
| Rhode Island | 6b–7b | 7a (53%) | 60% |
| South Carolina | 8a–9b | 8b (50%) | 62% |
| South Dakota | 4a–5b | 4b (48%) | 42% |
| Tennessee | 6b–8a | 7b (70%) | 86% |
| Texas | 6b–10b | 8b (38%) | 67% |
| Utah | 4a–8b | 6a (32%) | 35% |
| Vermont | 4a–6a | 5a (58%) | 61% |
| Virginia | 6a–8b | 7b (43%) | 65% |
| Washington | 6a–9b | 8b (37%) | 49% |
| West Virginia | 5b–7a | 7a (49%) | 79% |
| Wisconsin | 3b–6a | 5b (30%) | 44% |
| Wyoming | 4a–5b | 5a (58%) | 54% |
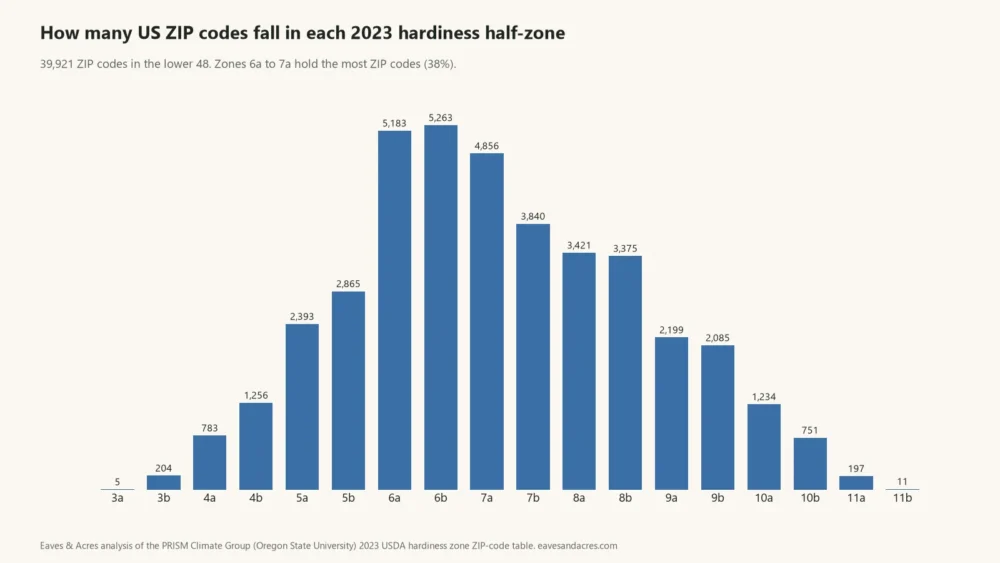
A zone measures one night in deep winter. It says nothing about when spring frost ends, which is what times tomatoes, seed starting and spring lawn work. Four big cities in zone 6b show the gap: the median last spring frost at each city’s nearest NOAA station falls on April 4 in Kansas City, April 10 in Chicago, April 20 in Columbus and April 21 in Detroit.4
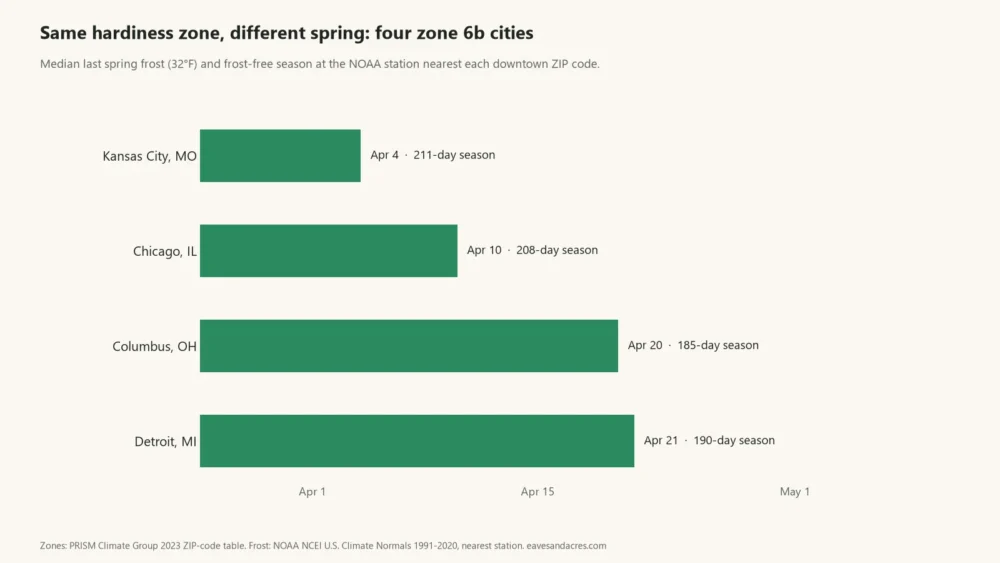
That spread is typical. In each half-zone from 4a to 9a, the middle 80% of ZIP codes spread across 18 to 32 days of last-frost dates, as we showed in planting zone vs frost date. Use the zone to choose plants and your frost dates by ZIP code to time them.
Nursery tags and catalogs list the zones where a perennial, shrub or tree survives winter.1 Choose plants rated for your zone or a colder one. A few practical points from USDA’s guidance:1
For bulbs and garlic, which go in by fall soil and frost timing rather than by zone alone, see when to plant tulip bulbs, when to plant daffodil bulbs and when to plant garlic. To start perennial seeds outdoors in winter, see winter sowing.
The zone in the lookup is read directly from the official ZIP-code table that the PRISM Climate Group at Oregon State University publishes for the 2023 USDA map, and is shown unaltered; the 2012 comparison uses the matching 2012 table.3 It covers 39,904 of the 41,488 ZIP codes in our climate file. PO-box and single-building ZIP codes, and Alaska, Hawaii and Puerto Rico, have no zone in the table we use, so the lookup says so instead of guessing. This page is not the official USDA map: you can check any address on USDA’s interactive map.5 Frost dates come from NOAA’s 1991–2020 normals for the station nearest your ZIP code; our methodology page lists every rule.4
Enter your ZIP code in the lookup above. It shows your USDA hardiness zone from the 2023 map, the average coldest-night range for that zone, your zone on the 2012 map and your median frost dates.
No. The current edition is the 2023 USDA Plant Hardiness Zone Map, released on November 15, 2023 and based on 1991–2020 weather data. USDA’s map site still serves it as of October 6, 2026.
Each zone covers 10°F of average coldest-night temperature and splits into two 5°F halves. Zone 7a averages 0 to 5°F on the coldest night of winter; 7b averages 5 to 10°F.
No. A zone measures the coldest winter night, not when spring frost ends. Cities in the same half-zone can have last frost dates weeks apart, so time vegetables with your frost dates.
Sometimes, in a sheltered spot, but USDA warns that plants grown at the edge of their range can thrive for years and then be lost in a rare cold snap.
USDA drew the 2023 map at half-mile detail, so zone lines can pass between neighboring ZIP codes. Your own yard can also run warmer or colder than the map because of microclimates.
Not necessarily, says USDA. It credits the changes to year-to-year swings in the coldest night, newer mapping methods and more weather stations, as well as to the newer 1991–2020 data.
Answers: when is my last frost?
Get a short email when it’s time to overseed, start seeds, open the pool or service your furnace — timed to your climate.