Planting Zone vs Frost Date: What a Hardiness Zone Can and Can’t Tell You
Hardiness zones and frost dates answer different questions. We matched the 2023 zone of 38,384 ZIP codes with NOAA frost dates to show how far apart the two can be, and which one to use for what.
- Last reviewed Oct 4, 2026
- 9 cited sources
- 7 min read
Set your ZIP to see dates for your area.
- 1A USDA hardiness zone measures the average coldest winter night. Use it to choose perennials, shrubs and trees.
- 2Frost dates mark when the frost-free season starts and ends. Use them to time planting.
- 3Across 38,384 ZIP codes, the median last frost varies by 18–32 days inside one half-zone (middle 80% of ZIP codes).
- 4Kansas City and Bend, Oregon, are both zone 6b, but their median last frosts are two months apart.
- 5Published frost-date-by-zone charts matched NOAA’s median last frost only about a third of the time.
Your planting zone and your frost dates answer different questions. A USDA hardiness zone tells you how cold the coldest night of a typical winter gets, which decides whether a perennial, shrub or tree survives. Your frost dates tell you when the frost-free season starts and ends, which decides when to plant. Use the zone to choose plants and the frost dates to time them.
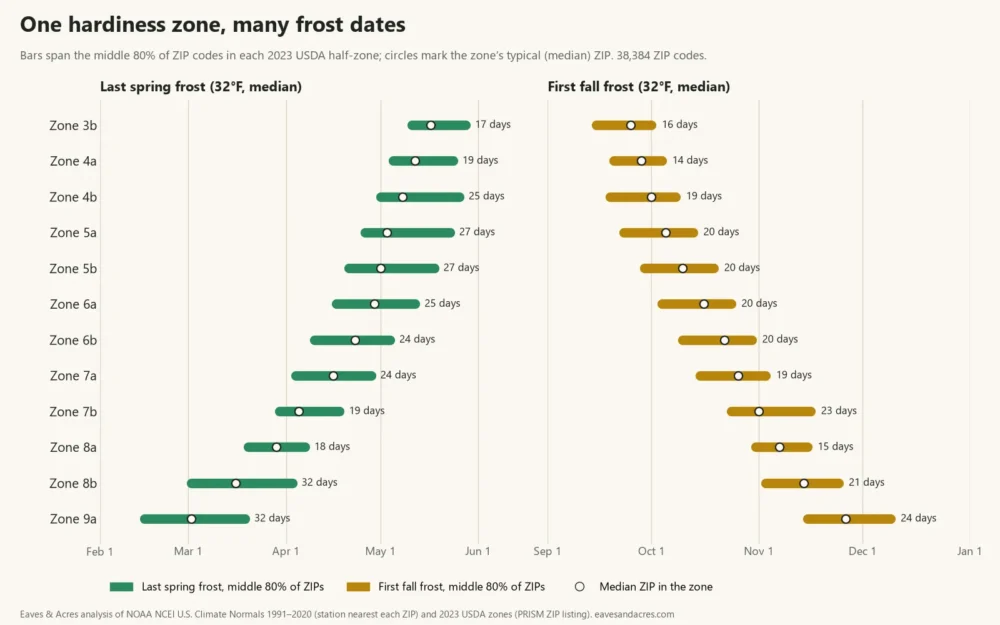
The two are only loosely related. We matched the 2023 zone of 38,384 US ZIP codes with NOAA frost dates: inside one half-zone, the last spring frost still varies by three to four weeks.
What a hardiness zone measures
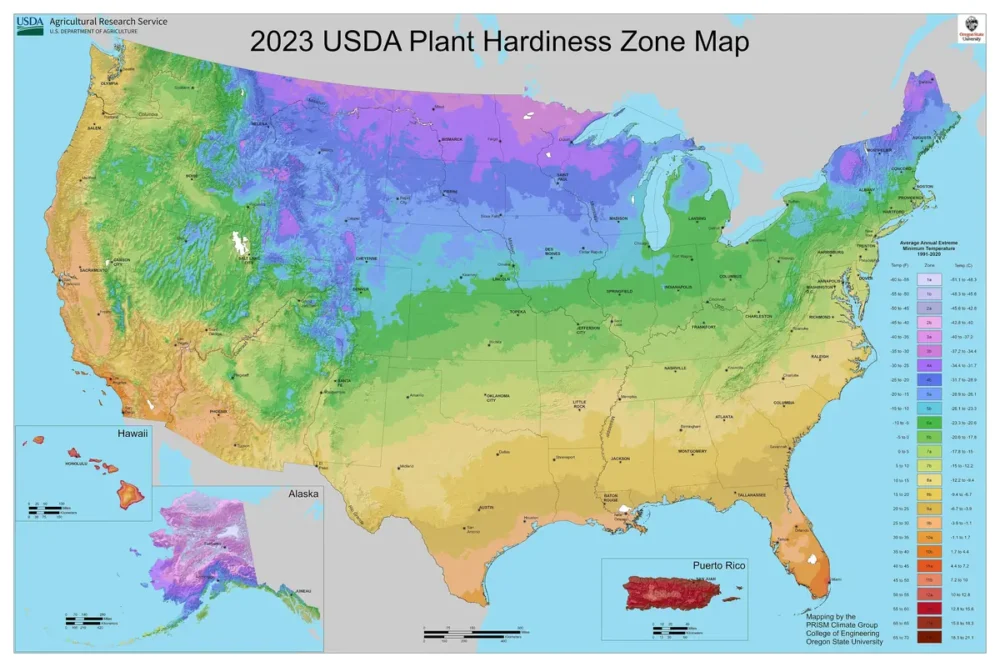
The USDA Plant Hardiness Zone Map rests on one number: the average annual extreme minimum winter temperature, that is, the coldest night of each winter, averaged over 1991–2020.2 Each zone spans 10°F, and the “a” and “b” halves split it into 5°F steps: 7a is the colder half of zone 7 and 7b the warmer half.3 The 2023 edition was mapped by Oregon State University’s PRISM Climate Group from 13,625 weather stations, on a grid of cells about half a mile across.4
USDA is clear about what the map is for. All of its zone maps, it says,
should serve as general guides for growing perennial plants
The map says nothing about spring or fall; USDA notes that it can’t account for wind, soil moisture, snow or an early-fall cold snap.3 The 2023 map runs about a quarter zone warmer than the 2012 map across much of the country, partly because of newer data and partly because of better mapping methods.4 USDA adds that a changed zone is no reason to remove plants that have done well.3
What a frost date measures
A frost date comes from daily temperature records at a weather station. NOAA’s 1991–2020 U.S. Climate Normals give each station’s last spring and first fall freeze at several levels of odds.1 NC State Extension explains the thresholds in those tables: 32°F is a freeze, 28°F a hard freeze, and 36°F is used for frost.6 Our frost vs. freeze guide explains the difference and the weather alerts for each. The dates on this site use 32°F at the station nearest your ZIP code.
The “average” (median) date is a coin flip: half of years still bring a later frost, so tender plants usually wait for the safer 10% date. Our frost dates by ZIP code show all four levels of odds. The days between your last and first frost are your frost-free growing season, and University of Vermont Extension explains why that matters for annual vegetables and flowers:
it’s important when selecting plants and seeds to know the length of your growing season
A tomato that needs 120 days won’t ripen in a 100-day season, UVM notes,7 whatever the zone.
Same zone, different frost dates: what our data shows
To measure how well a zone predicts frost, we took every ZIP code in the PRISM Climate Group’s ZIP listing for the 2023 map (lower 48 states)5 and matched it with the NOAA median frost dates from the station nearest it.1 38,384 ZIP codes had both. We checked 16 of the zones against USDA’s own map viewer, and all 16 matched.
| Half-zone | ZIP codes | Median last spring frost | Median first fall frost | Frost-free days |
|---|---|---|---|---|
| 3b | 204 | May 17 (May 11 – May 28) | Sep 25 (Sep 15 – Oct 1) | 130 (106–142) |
| 4a | 783 | May 12 (May 5 – May 24) | Sep 28 (Sep 20 – Oct 4) | 137 (118–151) |
| 4b | 1,256 | May 8 (May 1 – May 26) | Oct 1 (Sep 19 – Oct 8) | 145 (116–159) |
| 5a | 2,393 | May 3 (Apr 26 – May 23) | Oct 5 (Sep 23 – Oct 13) | 153 (122–169) |
| 5b | 2,865 | May 1 (Apr 21 – May 18) | Oct 10 (Sep 29 – Oct 19) | 162 (133–179) |
| 6a | 5,183 | Apr 29 (Apr 17 – May 12) | Oct 16 (Oct 4 – Oct 24) | 170 (146–188) |
| 6b | 5,263 | Apr 23 (Apr 10 – May 4) | Oct 22 (Oct 10 – Oct 30) | 181 (158–200) |
| 7a | 4,856 | Apr 16 (Apr 4 – Apr 28) | Oct 26 (Oct 15 – Nov 3) | 191 (170–211) |
| 7b | 3,840 | Apr 5 (Mar 30 – Apr 18) | Nov 1 (Oct 24 – Nov 16) | 210 (189–232) |
| 8a | 3,404 | Mar 29 (Mar 20 – Apr 7) | Nov 7 (Oct 31 – Nov 15) | 224 (206–241) |
| 8b | 3,375 | Mar 16 (Mar 2 – Apr 3) | Nov 14 (Nov 3 – Nov 24) | 242 (216–263) |
| 9a | 2,194 | Mar 2 (Feb 15 – Mar 19) | Nov 26 (Nov 15 – Dec 9) | 269 (239–299) |
| 9b | 2,024 | Feb 1 (Jan 12 – Feb 26) | Dec 14 (Dec 1 – Jan 3) | 319 (279–346) |
Zones do follow frost in broad strokes. One half-zone warmer moves the median last frost about 9 days earlier and the first frost about 7 days later. But inside one half-zone, from 4a to 9a, the middle 80% of ZIP codes spread across 18 to 32 days in spring and 14 to 24 days in fall. About one ZIP code in seven is more than two weeks from its zone’s median last frost. The frost-free season varies even more: 33 to 60 days inside a half-zone.
Cities that share a zone but not a season
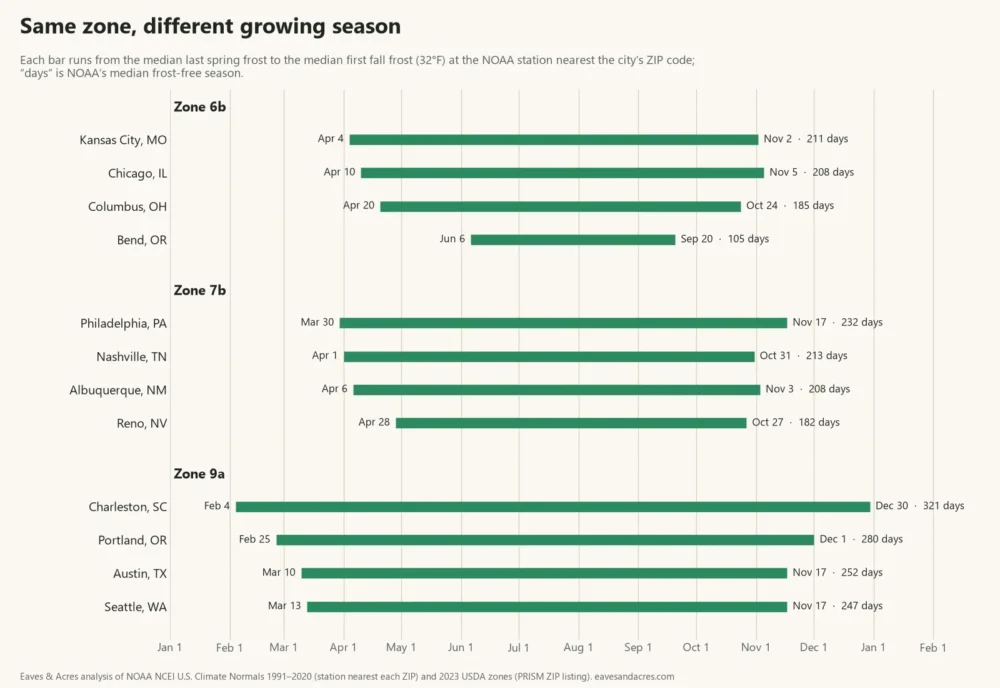
Kansas City and Bend, Oregon, are both zone 6b. Kansas City’s median last frost is April 4 and its frost-free season runs 211 days. Bend’s station, at 3,660 feet, has a median last frost of June 6 and a 105-day season. Philadelphia and Reno share zone 7b, yet Reno’s last frost comes four weeks later. In zone 9a, Charleston, South Carolina, gets a 321-day season and Seattle gets 247.
Same frost date, different zones
It works the other way, too. Des Moines (zone 5b), Omaha (6a), Amarillo (7a) and Corvallis, Oregon (8b) all have a median last frost between April 15 and April 18, yet their zones are 30°F apart in winter cold. Of the 3,553 ZIP codes whose median last frost falls between April 10 and 16, at least 1% fall in each of seven half-zones, from 5b to 8b.
Frost-date-by-zone charts, tested
Some garden sites publish frost dates by zone. We tested two against NOAA normals for every ZIP code in each zone. Garden Design lists a date range per zone;8 Lowe’s gives one date per zone, with the same April 15 last frost for zones 5, 6 and 7.9
| Zone | ZIP codes | NOAA median, typical ZIP | Garden Design range | ZIPs inside the range | Lowe’s date | ZIPs within 7 days |
|---|---|---|---|---|---|---|
| Zone 3 | 209 | May 17 | May 1–May 16 | 47% | May 15 | 71% |
| Zone 4 | 2,039 | May 10 | Apr 24–May 12 | 59% | May 15 | 48% |
| Zone 5 | 5,258 | May 2 | Apr 7–Apr 30 | 41% | Apr 15 | 8% |
| Zone 6 | 10,446 | Apr 25 | Apr 1–Apr 21 | 34% | Apr 15 | 35% |
| Zone 7 | 8,696 | Apr 11 | Mar 22–Apr 3 | 23% | Apr 15 | 46% |
| Zone 8 | 6,779 | Mar 24 | Mar 13–Mar 28 | 47% | Mar 15 | 34% |
| Zone 9 | 4,218 | Feb 21 | Feb 6–Feb 28 | 32% | Feb 15 | 19% |
| Zones 3–9 | 37,645 | — | — | 36% | — | 33% |
Across zones 3 to 9, Garden Design’s last-frost range contained a ZIP code’s median last frost 36% of the time, and the Lowe’s date was within a week of it 33% of the time. The misses are not harmless. In zone 5, April 15 comes before the median last frost in almost every ZIP code (99.5%), and in 64% of them a later frost arrives in at least 9 years out of 10.
When to use your zone and when to use your frost dates
| Your question | Use | Why |
|---|---|---|
| Will this perennial, shrub or tree survive the winter? | Hardiness zone (the “hardy to zone 5” on the tag) | Winter survival depends on the coldest nights, which is what the zone measures |
| Can a tender perennial stay outside all winter? | Hardiness zone | UVM: tender perennials return only in a warm enough zone and won’t survive freezing |
| When can tomatoes and other tender crops go outside? | Last spring frost, at 10% odds | When to plant tomatoes adds warm nights to the frost date |
| When do I sow seeds indoors? | Last spring frost and planting-out date | When to start seeds indoors counts back from planting out |
| Will this variety ripen in time? | Frost-free season length | Compare days to maturity with the days between frosts |
| When do garlic and spring bulbs go in? | First fall frost | Garlic and tulip bulbs are planted around it |
| Do I need to cover plants tonight? | The forecast low | Frost dates only tell you when to start watching; see when to cover plants for frost |
Find both numbers for your address
Look up your zone with the ZIP code search on USDA’s official Plant Hardiness Zone Map, which is the authoritative source; the zones in this guide come from its published ZIP data. Our planting zone lookup shows the same zone next to your 2012 zone and frost dates. Then look up your last and first frost dates by ZIP code. Our methodology page explains how each ZIP code is matched to a NOAA station.
Frequently asked questions
April 23 for the typical zone-6b ZIP code, but the middle 80% run from April 10 to May 4, and Bend, Oregon (also 6b) waits until June 6. Use your own ZIP code’s date.
April 16 for the typical zone-7a ZIP code, but the middle 80% run from April 4 to April 28, so the typical last frost in some 7a gardens comes more than three weeks before it does in others. Look up your own ZIP code’s date.
No. The “b” half is the warmer one: zone 5a covers average coldest nights of −20 to −15°F, and 5b covers −15 to −10°F.
Only as a rough guess. A zone calendar gives one date to places whose last frost differs by weeks. Count from your own frost dates.
Yes. The median date still brings a later frost in half of years. For tender plants, use the 10% date, when the odds fall to one in ten.
It uses 1991–2020 weather data and better mapping methods, and USDA says it runs about a quarter zone warmer in much of the country. Plants that are doing well need not be replaced.
Only loosely. Inside one half-zone, the frost-free season of the middle 80% of ZIP codes varies by 33 to 60 days. Your frost dates give the real length.
Sources
- 1.U.S. Climate Normals 1991–2020. NOAA National Centers for Environmental Information, 2021. Used for: median last and first 32°F frost and frost-free season for every ZIP code and city Back to text
- 2.USDA Plant Hardiness Zone Map. USDA Agricultural Research Service, 2023. Used for: the map is based on the average annual extreme minimum winter temperature; official ZIP code search Back to text
- 3.How to Use the Maps. USDA Agricultural Research Service, 2023. Used for: 10°F zones and 5°F half-zones; use for perennials; factors the map leaves out; changed zones Back to text
- 4.Map Creation. USDA Agricultural Research Service, 2023. Used for: 13,625 stations, PRISM mapping on a half-mile grid, about a quarter zone warmer than 2012 Back to text
- 5.2023 USDA Plant Hardiness Zone GIS Datasets (ZIP code listing). PRISM Climate Group, Oregon State University, 2023. Used for: 2023 half-zone for 39,921 contiguous-US ZIP codes (data behind the official map; not the official map itself) Back to text
- 6.Interpreting Freeze / Frost Probabilities from the National Centers for Environmental Information (AG-873). NC State Extension (Natalie Nelson, Layla El-Khoury), 2020, reviewed 2024. Used for: 32°F freeze, 28°F hard freeze, 36°F frost; reading probability levels Back to text
- 7.USDA Hardiness Zones. University of Vermont Extension (Deborah J. Benoit, Extension Master Gardener), 2023. Used for: growing-season length from frost dates; tender perennials Back to text
- 8.First and Last Frost Dates. Garden Design, 2025. Used for: published frost-date ranges by zone, tested in Table 2 Back to text
- 9.How to Understand Frost & Freeze Dates. Lowe’s, n.d. Used for: published frost dates by zone, tested in Table 2 Back to text
How this guide was made
- Written by the Data & Methodology Desk and reviewed by the Yard & Garden Desk.
- Data: median frost dates and frost-free season from NOAA NCEI U.S. Climate Normals 1991–2020 for the station nearest each ZIP code; 2023 USDA hardiness zones from the PRISM Climate Group (Oregon State University) ZIP code listing, spot-checked against USDA’s map viewer; definitions from USDA ARS, NC State Extension and University of Vermont Extension. See our methodology.
- AI use: AI tools help us research, draft and check this guide. Every figure is checked against the source cited for it, and calculated figures come from our own code, described on the methodology page.
- Spotted an error? Tell us — the form opens with this page’s address filled in.
Change log
- Oct 4, 2026Re-checked the USDA, UVM and NC State statements against the live pages; added a FAQ on the zone 7a last frost date from the same NOAA and zone data as Table 1.
- Oct 3, 2026Published. Frost dates for 38,384 ZIP codes (NOAA 1991–2020 normals) matched with 2023 hardiness zones from the PRISM Climate Group ZIP listing; 16 zones spot-checked against USDA’s map viewer; two published zone frost-date charts tested.
Maintains the climate dataset behind every ZIP lookup, documents each tool’s formula, and reviews every guide’s numbers before publication.
Keep reading
2023 USDA Hardiness Zone Map Changes: Did Your Zone Change, and Why?
What changed on the 2023 USDA hardiness zone map and why, with the 2012-to-2023 change for 39,899 ZIP codes by state and city.
What Is a Last Frost Date? What the 10%, 30%, 50% and 90% Odds Mean
A last frost date is a probability, not a deadline. What NOAA’s 10%, 30%, 50% and 90% dates mean, and a test of how often they held up at 967 airport stations.
Frost vs. Freeze: What Each Means, the NWS Alerts and Your Growing Season
Frost is ice on surfaces; a freeze is air at 32°F or colder. NWS alerts explained, and NOAA data on how each threshold changes your growing season.
Seasonal reminders for your ZIP
Get a short email when it’s time to overseed, start seeds, open the pool or service your furnace — timed to your climate.