


How Much Does It Cost to Run a Hot Tub? The Math by City
We took the certified standby watts of 1,566 hot tubs, California’s own label formula, NOAA monthly normals and 2026 state electricity prices, and priced one tub month by month in 21 US cities.
- Last reviewed Oct 7, 2026
- 16 cited sources
- 10 min read
- 1The median hot tub certified in California uses 188 W in standby; its label formula makes that 1,647 kWh a year, about $300 ($25 a month) at the 2026 US average price.
- 2Scaled to NOAA monthly normals, the same tub’s January standby costs $20 in Miami to $82 in Boston; July runs $4–$32.
- 3Electricity price can outweigh cold: Boston’s January costs more than Fargo’s despite 21°F milder air.
- 4Each 2°F of water temperature moves yearly standby energy 3–8%; CPSC’s maximum is 104°F.
- 5Labels and our estimates leave out soaking time, jets and refills; one 331-gallon refill from 55°F tap water takes about 38 kWh ($7).
Keeping a hot tub hot costs about $25 a month in electricity for the median model certified in California, at the US average price and by the formula on its energy label. In January, our estimate for the same tub runs from $20 (Miami) to $82 (Boston). That is standby only: the tub at 102°F with its cover on. Soaking time, jets and refills add to it, and we found no published test that measures how much.
Most cost guides start from an assumed number of heater hours. We started from measured data: the certified standby watts of 1,566 approved hot tubs in the California Energy Commission’s appliance database, scaled to each month’s normal temperature in 21 US cities and priced at each state’s 2026 residential electricity rate.
Start with the number on the energy label
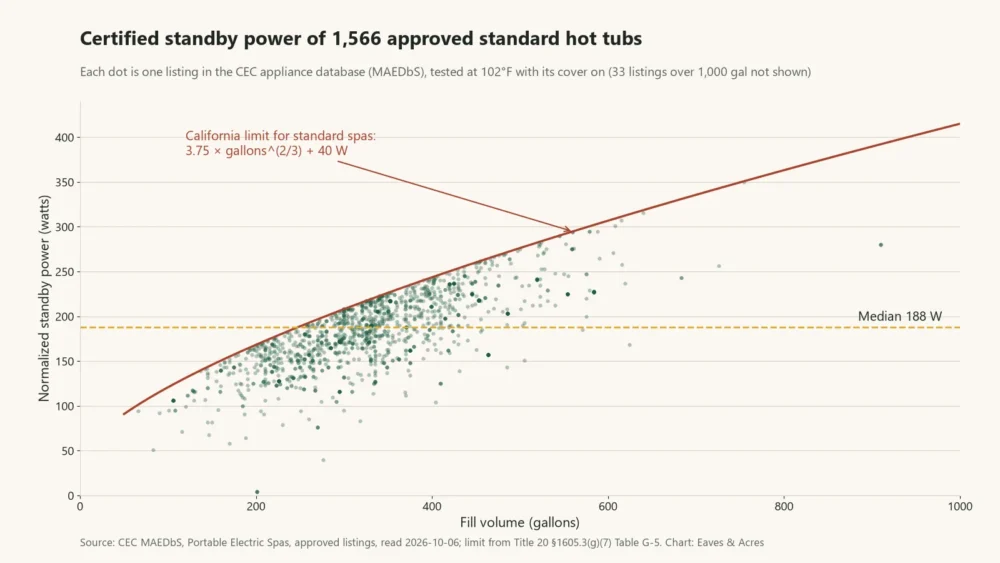
Every portable electric spa sold in California must pass a standby test under the state’s Title 20 appliance rules. The tub is filled, held at about 102°F with the manufacturer’s specified cover on and left unused, and the total electricity it draws is reported as “normalized standby power”: watts, adjusted to a standard 37°F gap between water and air.1,11,12 For a standard spa the limit is 3.75 × fill volume2/3 + 40 watts, set in the approved Title 20 text.1 Manufacturers must list each model, with the cover it was tested with, in the CEC’s Modernized Appliance Efficiency Database System (MAEDbS), which anyone can search.2,3
The required label turns that into a yearly figure: standby watts × 8,760 hours = kilowatt-hours a year, and kWh × your rate = annual standby cost.1 It also states what it leaves out:
does not include spa usage or extreme cold conditions.
We read all 2,229 approved listings on October 6, 2026. The 1,566 standard (non-inflatable, non-swim) spas with test data, from 54 manufacturers, have a median standby power of 188 watts at a median fill of 331 gallons; the middle 80% run 132–237 watts. The median listing uses 86% of its legal limit.
| Fill volume | Listings | Median standby | Middle 80% | Median limit | Label math at US average price |
|---|---|---|---|---|---|
| Up to 250 gal | 298 | 143 W | 106–169 W | 173 W | 1,253 kWh, $228 |
| 251–350 gal | 648 | 180 W | 141–210 W | 212 W | 1,577 kWh, $287 |
| 351–450 gal | 392 | 216 W | 163–237 W | 242 W | 1,897 kWh, $345 |
| Over 450 gal | 228 | 236 W | 200–455 W | 282 W | 2,072 kWh, $377 |
Label math for the median tub: 188 W × 8,760 h = 1,647 kWh a year, or $300 at the US residential average of 18.19¢ per kWh for January–July 2026.4 That figure assumes a constant 65°F outdoors (102°F minus the 37°F test gap), which no US city has all year.
What the same hot tub costs by city and month
The CEC normalizes its test by assuming heat loss rises in step with the difference between water and air temperature.1 We applied that same scaling to each month’s normal mean air temperature (NOAA 1991–2020 normals, nearest station)5 and each state’s residential electricity price from the Energy Information Administration.4 The formula is monthly kWh = standby watts × (102°F − average air temperature) ÷ 37 × hours in the month ÷ 1,000. Extending a lab normalization to real weather is our assumption: wind, sun, rain and snow are not in it.
| City (normal air Jan / Jul · price per kWh) | Standby cost, Jan / Jul | Per year (range · kWh) |
|---|---|---|
| Fargo, ND 9°F / 71°F · 12.4¢ | $43 / $15 | $328 $230–$414 · 2,655 kWh |
| Minneapolis, MN 15°F / 74°F · 16.2¢ | $54 / $17 | $406 $284–$511 · 2,496 kWh |
| Madison, WI 19°F / 72°F · 19.0¢ | $59 / $22 | $463 $324–$583 · 2,434 kWh |
| Omaha, NE 24°F / 78°F · 12.9¢ | $38 / $12 | $284 $199–$358 · 2,201 kWh |
| Chicago, IL 26°F / 76°F · 19.2¢ | $55 / $19 | $426 $298–$537 · 2,215 kWh |
| Detroit, MI 26°F / 74°F · 21.5¢ | $62 / $23 | $493 $345–$621 · 2,288 kWh |
| Columbus, OH 29°F / 75°F · 18.7¢ | $52 / $19 | $409 $286–$515 · 2,186 kWh |
| Boston, MA 30°F / 74°F · 30.1¢ | $82 / $32 | $671 $470–$846 · 2,226 kWh |
| Kansas City, MO 31°F / 81°F · 14.0¢ | $37 / $11 | $279 $196–$352 · 2,002 kWh |
| Salt Lake City, UT 34°F / 81°F · 13.2¢ | $34 / $11 | $270 $189–$340 · 2,052 kWh |
| New York, NY 34°F / 78°F · 29.4¢ | $76 / $27 | $603 $423–$761 · 2,053 kWh |
| Louisville, KY 35°F / 79°F · 14.3¢ | $36 / $12 | $279 $195–$351 · 1,952 kWh |
| Denver, CO 35°F / 77°F · 16.7¢ | $42 / $16 | $361 $253–$456 · 2,161 kWh |
| Nashville, TN 38°F / 79°F · 13.9¢ | $34 / $12 | $263 $184–$332 · 1,898 kWh |
| Portland, OR 42°F / 69°F · 15.4¢ | $35 / $19 | $323 $227–$408 · 2,100 kWh |
| Seattle, WA 43°F / 67°F · 14.4¢ | $32 / $19 | $308 $216–$389 · 2,142 kWh |
| Atlanta, GA 44°F / 80°F · 15.4¢ | $34 / $13 | $271 $190–$342 · 1,762 kWh |
| Dallas, TX 48°F / 87°F · 16.1¢ | $33 / $9 | $242 $170–$305 · 1,508 kWh |
| Sacramento, CA 49°F / 78°F · 33.2¢ | $67 / $30 | $570 $400–$719 · 1,716 kWh |
| Phoenix, AZ 57°F / 96°F · 15.4¢ | $26 / $4 | $181 $127–$228 · 1,172 kWh |
| Miami, FL 67°F / 83°F · 15.3¢ | $20 / $11 | $176 $124–$222 · 1,153 kWh |
Range: tubs at the 10th and 90th percentile of certified standby watts (132 and 237 W). Prices are state averages.
January in Minneapolis
- Scenario
- The median certified tub (188 W standby) kept at 102°F through a Minneapolis January, when NOAA’s normal mean air temperature is 14.9°F.
- Math
- 102 − 14.9 = 87.1°F, which is 2.35 times the 37°F test gap. 188 W × 2.35 = 443 W, around the clock. 443 W × 744 hours = 329 kWh × 16.25¢ (Minnesota, January–July 2026).
- Answer
- About $54 of standby electricity for the month, against $17 in July. Soaking time comes on top.
Swap in your own numbers: your tub’s standby watts, your monthly temperature from our climate data and your price per kWh. Our heat pump vs. furnace guide uses the same EIA prices and NOAA normals for home heating, and our saltwater vs. chlorine pool guide prices a salt cell’s electricity the same way.
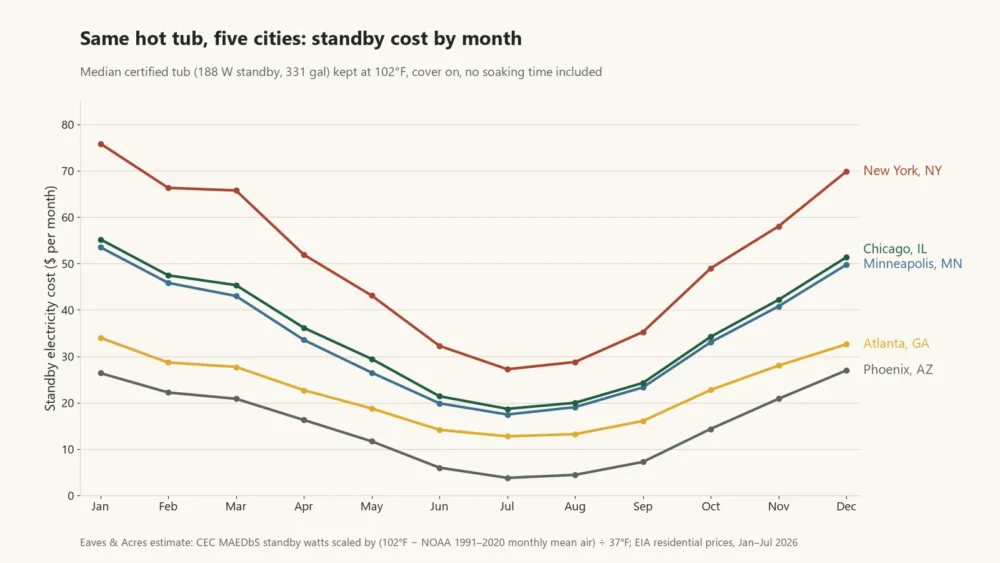
Cost to run a hot tub in winter
In our table, January standby costs 1.7 to 7.0 times July’s, from Seattle to Phoenix. Boston’s January air (30°F) is 21 degrees milder than Fargo’s, yet the same tub costs $82 there against $43 in Fargo, because Massachusetts power averaged 30.1¢ per kWh and North Dakota’s 12.4¢.
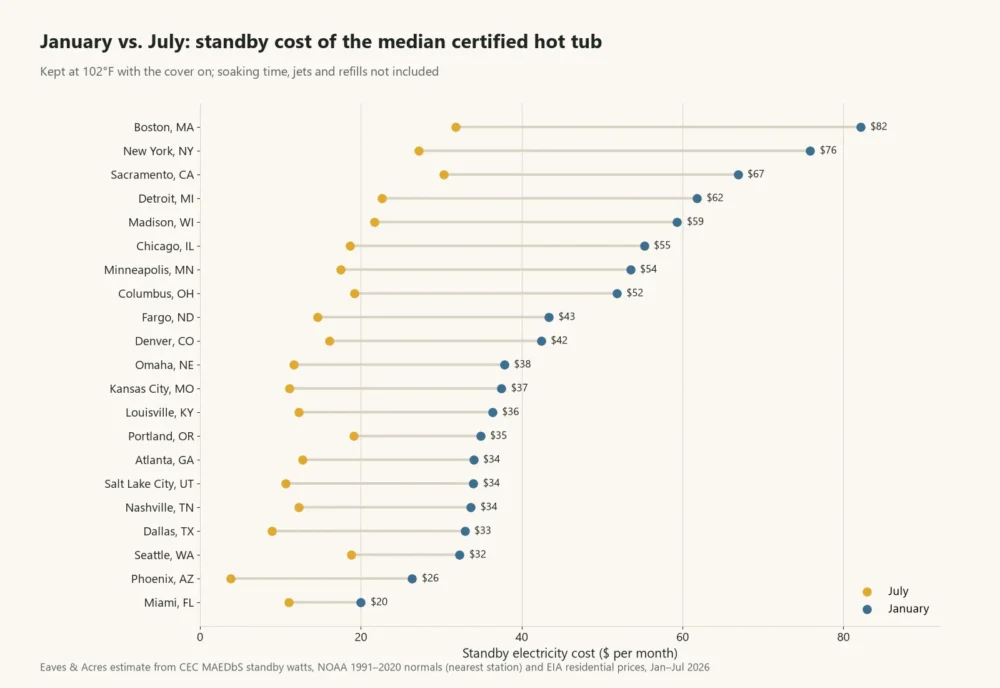
Unlike a pool you close for the winter, a hot tub kept running all year pays for these months too. Our estimates use average temperatures, so a cold snap costs more than the monthly figure shows, and the CEC label itself excludes extreme cold.
What changes the bill
- Size. The limit grows with volume, and so do certified watts: a median 143 W for tubs of 250 gallons or less against 236 W above 450 gallons (Table 1).
- The tub’s own efficiency. Among 251–350-gallon listings, a tub at the 90th percentile draws about 1.5 times the standby watts of one at the 10th. Compare the label or the MAEDbS listing before you buy.
- 120 V vs. 240 V. Among 251–450-gallon listings, 122 plug-in-class models (rated 110–120 V) have a median standby of 166 W at 285 gallons, and 918 models rated 199–257 V a median 194 W at 340 gallons. Per 100 gallons that is 58 W against 57 W: in this data, 120 V tubs use less standby power because they are smaller, not because of the voltage.
- Inflatable spas. California sets inflatable spas a looser limit, 7 × fill volume2/3 watts, and a label duty cycle of 5,040 hours a year instead of 8,760.1 The 328 approved inflatable listings with data have a median of 238 W for 259 gallons, about 95 W per 100 gallons against 57 W for standard spas.
- Your price per kWh. State averages in our table run from 12.4¢ to 33.2¢, so the same tub costs 2.7 times as much to run in California as in North Dakota before weather.
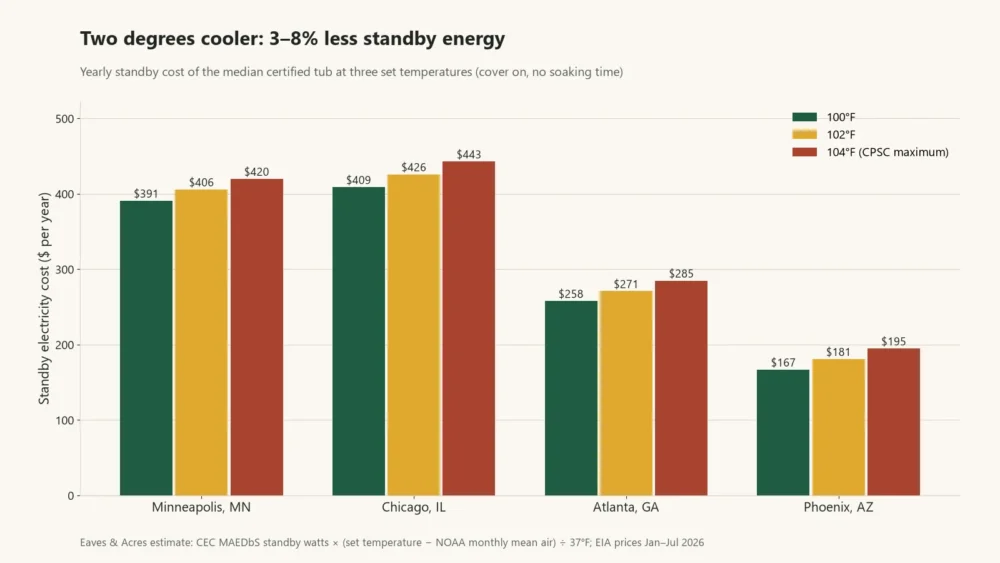
Water temperature: 100°F vs. 102°F vs. 104°F
Hot tub water temperatures should never exceed 104 degrees Fahrenheit.
CPSC’s hot tub warning also notes that 100°F is considered safe for a healthy adult. Within those limits, the setting matters because standby loss follows the water–air gap. By the same formula, keeping the median tub at 104°F instead of 102°F adds 3–8% to its yearly standby energy across our cities, and 100°F saves the same share. The percentage is largest in warm places, where the gap is small to begin with. Google’s AI answer, when we checked in October 2026, put the saving from a 1–2°F drop at roughly 10%; by the CEC formula, 2°F is worth 3–8% of standby.
| City | 100°F | 102°F | 104°F | 104°F vs. 102°F |
|---|---|---|---|---|
| Fargo, ND | $317 | $328 | $339 | +3% |
| Minneapolis, MN | $391 | $406 | $420 | +4% |
| Chicago, IL | $409 | $426 | $443 | +4% |
| New York, NY | $577 | $603 | $629 | +4% |
| Denver, CO | $347 | $361 | $376 | +4% |
| Atlanta, GA | $258 | $271 | $285 | +5% |
| Dallas, TX | $228 | $242 | $257 | +6% |
| Phoenix, AZ | $167 | $181 | $195 | +8% |
| Miami, FL | $163 | $176 | $190 | +8% |
Is it cheaper to keep a hot tub hot all the time?
Not by the heat balance behind the CEC test. Several top search results, and Google’s AI answer, say the opposite without showing numbers. A cooler tub loses heat more slowly, and reheating only replaces the heat that was lost, so with an electric heater a setback does not use more energy. Idaho Power’s advice matches: 102°F when in use, “a lower temperature at other times,” with keeping it near 98–100°F mainly a convenience for tubs used often.7 The utility also notes that a typical covered tub loses about half a degree an hour with the heater off and gains about 4 degrees an hour with it on, so plan the warm-up.7
Refilling and reheating
Each refill means heating a full tub from tap temperature. One British thermal unit raises one pound of water by 1°F, and 3,412 Btu equal one kWh;8 water weighs about 8.34 pounds a gallon at 50–60°F (USGS lists 62.4 pounds per cubic foot, and a cubic foot holds 7.48 gallons).9 For the median 331-gallon tub and 55°F tap water (our assumption; yours varies by place and season): 331 × 8.34 × (102 − 55) ÷ 3,412 = 38 kWh, about $7 at the US average price, if every kWh ends up in the water. A portable tub’s fill volume is in its MAEDbS listing; for a built-in spa, our pool volume calculator estimates gallons for round and rectangular shapes.
Ways to cut the cost, as the sources state them
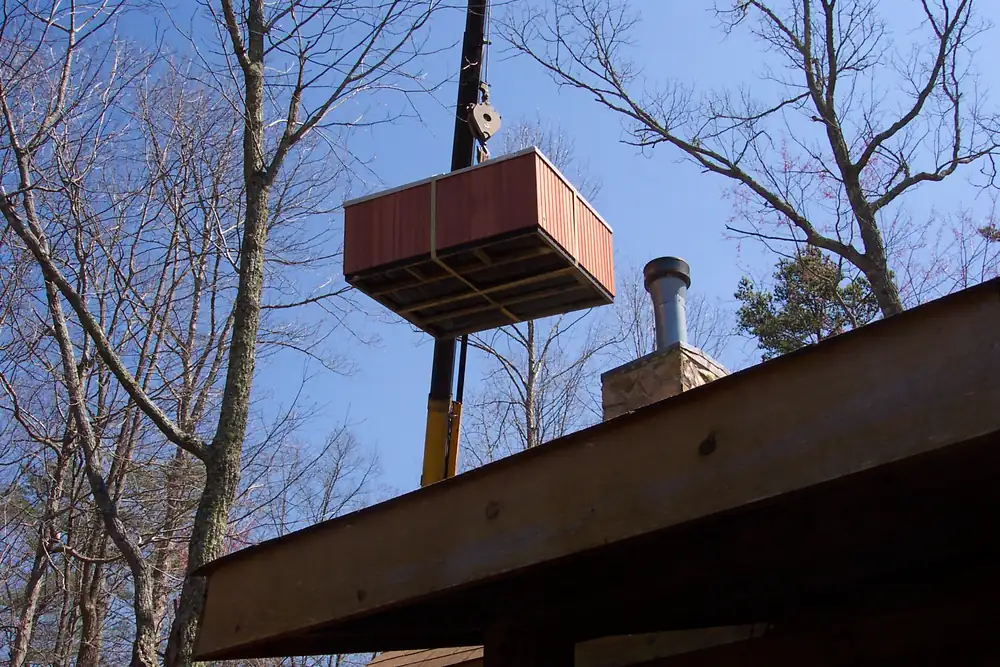
Hot air rises, so make sure your lid is gap-free and has good insulation.
- Keep the tested cover. California requires each tub to be sold with the cover it was tested with, or an approved equivalent also tested with it.1 A worn or different cover means the label no longer describes your tub. The often-repeated claim that about 70% of a hot tub’s heat escapes through the top had no test behind it in any source we read, so we don’t use it.
- Turn it down between uses. Idaho Power: lower the temperature when not in use, and in hot summers set it to the lowest setting or turn off the heater if the tub isn’t used regularly.7
- Block the wind, which Idaho Power says can cool the water while you soak, and keep filters clean: clogged ones, it says, strain the pump and reduce the heater’s efficiency.7
- Buy on the label. Same-size listings differ by about 1.5 times in standby watts (Table 1). Idaho Power also points to a separate, lower-wattage pump for filtering and settings that lower the heat when the tub is idle.7
What this estimate leaves out
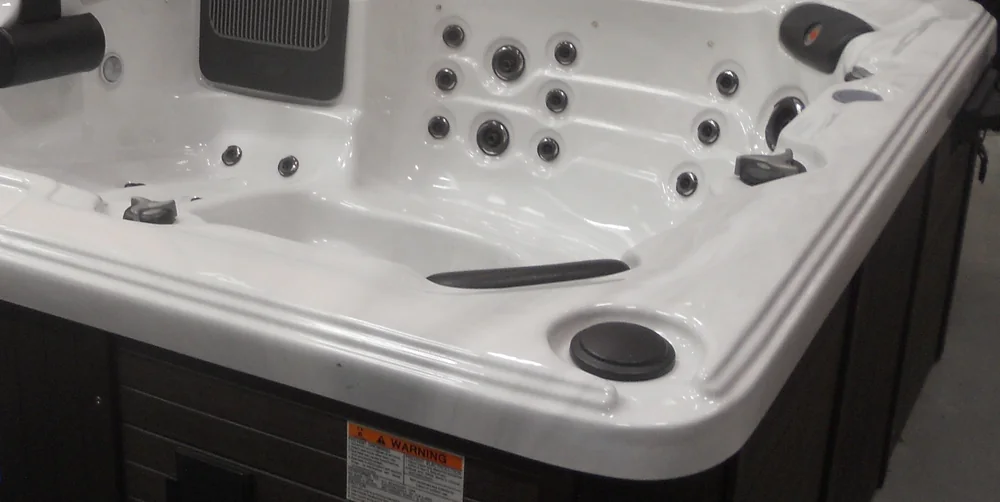
Soaking time with the cover off, jets, blowers, wind, snow and time-of-use rates are not in the label test, and we found no published measurement of them, so we give no number. Water care is a separate running cost: our hot tub chemical levels guide covers sanitizer and pH, and CDC’s minimums for pools are in our ideal pool chemical levels guide.10 For how we compute climate figures, see our methodology; more hot tub guides are in the hot tubs section.
Frequently asked questions
For the median certified tub kept at 102°F with its cover on, about $25 a month at the 2026 US average price by its label formula. Our city estimates run $20–$82 in January and $4–$32 in July, before soaking time.
The median approved standard spa in California’s database is rated 188 W of standby power, or 1,647 kWh a year on its label. By our NOAA-based estimate that becomes about 1,153 kWh a year in Miami and 2,655 in Fargo, before any use.
For the median certified tub, January standby comes to about $54 in Minneapolis, $55 in Chicago and $76 in New York at 2026 state prices, 1.7 to 7.0 times the July cost depending on the city.
Not for energy. A cooler tub loses heat more slowly, and reheating replaces only what was lost. Idaho Power advises 102°F in use and a lower setting at other times, and says a covered tub gains about 4°F an hour while heating.
Not per gallon in standby. Among 251–450-gallon listings, 120 V models are rated 58 W per 100 gallons and 240 V models 57 W. Plug-in tubs cost less to keep hot mainly because they are smaller.
In standby, the median tub’s 188 W is 0.19 kWh, about 3¢ an hour at the US average price, at the label’s 65°F outdoor temperature. In a Minneapolis January it is about 0.44 kWh, 7¢. Time with the cover off is extra.
Sources
- 1.Appliance Efficiency Regulations for Portable Electric Spas: OAL-approved final express terms, Cal. Code Regs. tit. 20 §1604(g)(2), §1605.3(g)(7) Table G-5, §1607(d)(14)(B) (docket 20-AAER-04, TN 239666). California Energy Commission, 2021 (effective 2022-01-01). Used for: standby limits (3.75 V^2/3 + 40 W standard, 7 V^2/3 inflatable), normalization to a 37°F gap, label formula (watts × 8,760 h; 5,040 h inflatable), "does not include spa usage" note, tested-cover rule Back to text
- 2.Portable Electric Spas: appliance efficiency outreach and education. California Energy Commission, accessed 2026-10-06. Used for: 2019 test procedure and labels, certification in MAEDbS Back to text
- 3.Modernized Appliance Efficiency Database System (MAEDbS), Pool Products > Portable Electric Spas, approved listings. California Energy Commission, read 2026-10-06 (Search > Advanced Search). Used for: 2,229 listings; standby watts, fill volume, voltage of 1,566 standard and 328 inflatable spas Back to text
- 4.Electric Power Monthly, Table 5.6.B: Average Price of Electricity to Ultimate Customers by End-Use Sector, by State, Year-to-Date through July 2026. U.S. Energy Information Administration, 2026. Used for: residential prices by state and US average (18.19¢), January–July 2026 Back to text
- 5.U.S. Climate Normals 1991–2020. NOAA National Centers for Environmental Information, 2021. Used for: monthly mean air temperatures for 21 cities (station nearest each ZIP code) Back to text
- 6.CPSC Warns of Hot Tub Temperatures (release 79-071). U.S. Consumer Product Safety Commission, 1979. Used for: 104°F maximum; thermostats may err by as much as four degrees Back to text
- 7.2018 Winter Energy Efficiency Guide ("Hot Tips for Hot Tubs"). Idaho Power, 2018. Used for: cover, wind, 102°F in use and lower at other times, filters, separate pump, about 4°F an hour of heating Back to text
- 8.Units and calculators explained: British thermal units. U.S. Energy Information Administration, accessed 2026-10-06. Used for: 1 Btu raises 1 lb of water 1°F; 1 kWh = 3,412 Btu Back to text
- 9.Water Density. U.S. Geological Survey, accessed 2026-10-06. Used for: 62.4 lb per cubic foot at 50–60°F (about 8.34 lb per gallon) Back to text
- 10.Home Pool and Hot Tub Water Treatment and Testing. Centers for Disease Control and Prevention, 2024. Used for: hot tub chemistry minimums (water care is a separate running cost) Back to text
- 11.Initial Statement of Reasons, Portable Electric Spas (docket 20-AAER-04, TN 237795). California Energy Commission, 2021. Used for: test conditions and standby method unchanged under ANSI/APSP/ICC-14 2019; existing standards not affected Back to text
- 12.Appliance Efficiency Standards Rulemaking for Portable Electric Spas, lead commissioner meeting slides (TN 222816). California Energy Commission, 2018. Used for: test held at 102°F ±2°F; label design Back to text
- 13.Hot Tubs Olympic Village Inn (photo). Rennett Stowe, Wikimedia Commons, CC BY 2.0, 2007. Used for: hero photo, cropped
- 14.House Meter (photo). Brian Cassidy, Wikimedia Commons, CC BY 2.0, n.d. Used for: photo, resized
- 15.Hot Tub Installation (photo). Darkshark0159, Wikimedia Commons, public domain, n.d. Used for: photo, resized
- 16.Gigantic hot tub for sale at B&Q (photo). ITookSomePhotos, Wikimedia Commons, CC0, n.d. Used for: photo, cropped
.jpg)


How this guide was made
- Written by the Pool Desk and reviewed by the Data & Methodology Desk.
- Data: standby watts and fill volumes of 1,566 approved standard portable electric spas (and 328 inflatable spas) from the California Energy Commission’s MAEDbS database, read 2026-10-06; limits, label formula (watts × 8,760 hours) and the 37°F normalization from Title 20 (§1605.3(g)(7), §1607(d)(14)(B)); monthly cost = standby watts × (set temperature − NOAA NCEI 1991–2020 normal monthly mean air temperature, station nearest each ZIP code) ÷ 37 × hours, our extension of the CEC normalization to real months; electricity from EIA Electric Power Monthly Table 5.6.B (residential, January–July 2026). Excludes soaking time with the cover off, jets, wind, sun and snow. Refill energy from the definition of a Btu (EIA) and USGS water density, with 55°F tap water assumed. See our methodology.
- AI use: AI tools help us research, draft and check this guide. Every figure is checked against the source cited for it, and calculated figures come from our own code, described on the methodology page.
- Spotted an error? Tell us — the form opens with this page’s address filled in.
Change log
- Oct 6, 2026Published. Hot tub standby cost from the certified standby watts of 1,566 approved standard spas in the CEC’s MAEDbS database (read 2026-10-06), the Title 20 label formula and normalization, NOAA 1991–2020 monthly normals for 21 cities and EIA residential prices (January–July 2026).
- Oct 7, 2026Re-checked the CEC label text, CPSC, Idaho Power and EIA figures; Table 2 rebuilt as three columns so it fits a phone screen with the same data; added Idaho Power’s heat-loss rate with the heater off and a comparison with the 10% saving claimed in Google’s AI answer.
Covers pool and hot tub water chemistry, opening and closing. We maintain the dosing calculators and check every rate against product chemistry and public health guidance.
Keep reading
How to Winterize a Hot Tub, and When to Keep It Running
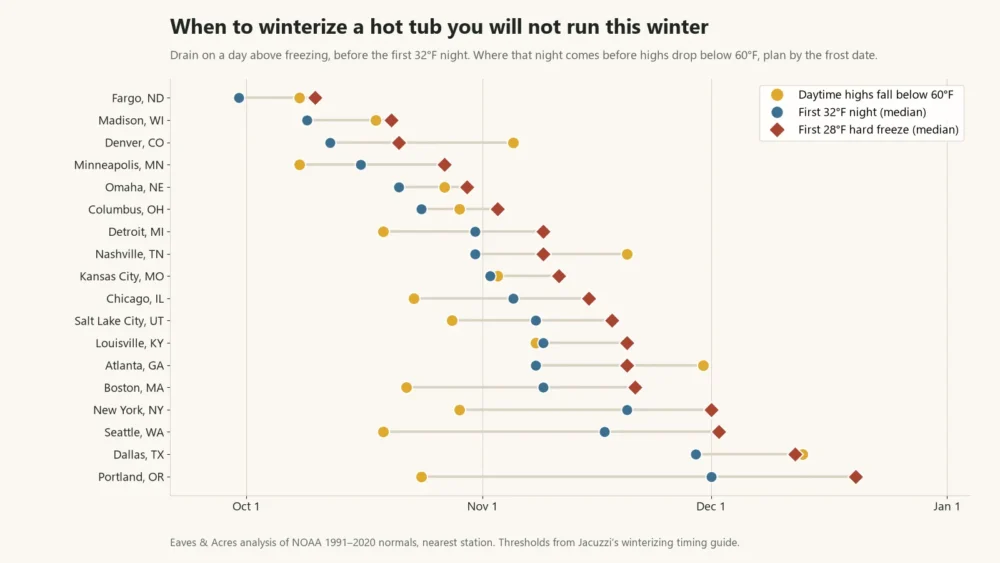
Hot tub makers say a tub kept full, heated and covered protects itself from freezing. When to drain and winterize instead, with NOAA freeze dates and winter running costs for 21 US cities.
Hot Tub Chemical Levels: Chlorine, Bromine and pH Ranges by Source
CDC’s hot tub minimums are at least 3 ppm free chlorine or 4 ppm bromine, pH 7.0–7.8, no stabilizer and water no hotter than 104°F. Three state spa codes and three spa manuals compared, plus testing and refill schedules.
When to Open Your Pool: Estimated Dates for Your City and State
Open before the water warms past 60°F and after freezing nights end. Estimated opening dates for 49 cities from NOAA climate normals, and how the 70°F rule compares.
Seasonal reminders for your ZIP
Get a short email when it’s time to overseed, start seeds, open the pool or service your furnace — timed to your climate.