

How Many BTU to Heat a Room? Rules of Thumb Tested Against Design Temperatures
We compared BTU-per-square-foot rules with DOE Manual J results, converted BTU to watts for electric heaters, and tested the rules against 99% design temperatures and heating degree days for 39 cities and 40,565 ZIP codes.
- Last reviewed Oct 26, 2026
- 20 cited sources
- 11 min read

- 1The popular rule is 30 to 60 BTU per hour per square foot; the only DOE Manual J results we found for new homes are 10.6 (Orlando) and 18.8 (Chicago).
- 2To convert BTU per hour to watts, divide by 3.412; a 1,500 W heater makes 5,118 BTU per hour.
- 3For the same house, load per square foot scales with the design temperature difference: Minneapolis (75°F) needs about 1.8 times Atlanta (43°F).
- 4One national number is within 25% for the same house in only 69% of 40,565 ZIP codes: 19% are milder and 12% are colder.
- 5The five-zone table runs 2.1 to 5.2 times our design-temperature estimate (zone averages), most in mild climates; Manual J by a contractor is the real answer.
The rule of thumb behind most BTU calculators, and behind Google’s AI Overview for this question, is 30 to 60 BTU per hour per square foot for heating: 4,500 to 9,000 BTU per hour (1,300 to 2,600 watts) for a 150 sq ft bedroom. The only Manual J results the Department of Energy (DOE) publishes for new homes that we found, in a Building America guideline, are far lower: 10.6 BTU per hour per square foot for a modeled house in Orlando and 18.8 for one in Chicago.1 What we added: NOAA 1991 to 2020 normals paired with 99% heating design temperatures for 39 cities and 40,565 ZIP codes. One national number is within 25% for the same house in only 69% of ZIP codes, and the popular five-zone table runs 2.1 to 5.2 times a design-temperature estimate (zone averages), most of all in mild climates. It is an estimate, not a load calculation.
What the popular BTU-per-square-foot rules say
Every top result starts from a per-square-foot multiplier, and none says where it comes from. The most common version is a five-row table running from “Zone 1 (hot)” at 30 to 35 BTU per square foot to “Zone 5 (cold)” at 50 to 60, repeated by an HVAC wholesaler and a calculator site.12,13 A Chicago contractor gives about 30 to 60.14 A fireplace retailer gives 10 to 15 in warm climates, 20 to 30 in moderate ones and 30 to 40 in cold ones.15 Carrier’s heat pump page says about 20 to 30 BTUs per square foot, as a general estimate:11
not as a replacement for a professional Manual J load calculation
| Source | Type | What it says | Btu/h per sq ft |
|---|---|---|---|
| National Air Warehouse; Inch Calculator | HVAC wholesaler; calculator site | Five-row table, Zone 1 (hot) 30 to 35 up to Zone 5 (cold) 50 to 6012 | 30 to 60 |
| Universal HVAC Group | Chicago contractor | Heating about 30 to 60, by insulation and building age14 | 30 to 60 |
| We Love Fire | Fireplace retailer | Warm 10 to 15, moderate 20 to 30, cold 30 to 40; chart for up to 1,000 sq ft: 20 / 30 / 45 by insulation15 | 10 to 45 |
| MBTEK | Heating equipment retailer | 20, 30, 40 or 50 by climate, building age and glass; “screening tool”19 | 20 to 50 |
| Carrier | Manufacturer (heat pump page) | About 20 to 30; chart is a general estimate, not a Manual J11 | 20 to 30 |
| Sheets Supply | Heating-supply retailer (baseboard) | 10 watts per sq ft, 12.5 older, 8.5 ultra-insulated16 | 29 to 43 |
| Consumer Reports | Product testing | Tested 1,500 W heaters claimed to heat about 150 to 200 sq ft9 | 26 to 34 |
| DOE Building America (Burdick, 2011) | Federal program; Manual J on two modeled homes | Orlando house 23,600 Btu/h; Chicago house 41,700 Btu/h; 2,223 sq ft above grade1 | 10.6 and 18.8 |
The tables disagree by two to three times for the same kind of climate, and none of the pages we read ties a number to a calculated load. DOE’s Building America program says rules of thumb date from older construction:1
these rules of thumb have not changed
Its context: codes once demanded little insulation, so sizing rules grew up around that construction, while buildings have become more efficient since 2000.1 The ACCA Manual J standard, which DOE and ENERGY STAR use, produces equipment sizing loads for single-family homes, townhouses and condos.5
Converting BTU to watts for an electric heater
The U.S. Energy Information Administration says one kilowatt-hour equals 3,412 BTU, so 1 watt is 3.412 BTU per hour.6 A 1,500 W heater makes 5,118 BTU per hour, and DOE says electric resistance heating is 100% energy efficient in the sense that all the incoming electric energy is converted to heat.8 To get watts from a BTU figure, divide by 3.412: 4,500 BTU/h is 1,319 W.
Retail baseboard guides use watts. One heating-supply retailer says 10 watts per square foot for modern construction with 8 ft ceilings, 12.5 for older homes with little insulation and 8.5 for ultra-insulated ones:16 34.1, 42.6 and 29.0 BTU per hour per square foot, in line with the 30 to 60 rule and not with DOE’s models. We found no source for a 20 to 30 watts per square foot rule; it would be 68 to 102 BTU per hour per square foot, above every figure in Table 1. Consumer Reports says many heaters it tested are claimed to heat only about 150 to 200 square feet and should be supplemental heat.9 DOE says to choose a heater of the proper size for the room and not an oversized one.7
| Heater | Btu per hour | Covers at 34.1 | Covers at 18.8 | Covers at 10.6 |
|---|---|---|---|---|
| 500 W | 1,706 | 50 | 91 | 161 |
| 750 W | 2,559 | 75 | 136 | 241 |
| 1,000 W | 3,412 | 100 | 182 | 321 |
| 1,500 W | 5,118 | 150 | 273 | 482 |
| 2,000 W | 6,824 | 200 | 364 | 643 |

The design-temperature method behind Manual J
A load calculation works out how fast a house loses heat on the coldest night you design for. ENERGY STAR’s HVAC design report uses a 70°F indoor design temperature for heating in room-by-room loads, and EPA’s design temperature guide recommends the Manual J 99% heating design temperature of the nearest weather location.3,4 That is the outdoor temperature a place stays above for 99% of the hours in a year; about 88 hours a year are colder.20 The gap from 70°F is the temperature difference (ΔT). For the same house, load per square foot scales with ΔT, so a house in Minneapolis (ΔT about 75°F) needs about 1.8 times what an identical one needs in Atlanta (43°F).
DOE’s two modeled houses give real numbers. Both are 2,223 sq ft above grade and meet the 2009 International Energy Conservation Code; the Chicago one also has a full conditioned basement. At a 2°F design temperature the Chicago house has a 41,700 BTU/h heating load; at 42°F the Orlando house has 23,600.1 Dividing by area and ΔT gives heat-loss rates of 0.276 BTU/h per °F per square foot (Chicago) and 0.379 (Orlando). We apply that range to any city as “a home like DOE’s two models.” The Chicago figure ignores the basement’s floor area, so its true per-square-foot rate is lower.
A 150 sq ft room in a Chicago-type home
- Scenario
- NOAA normals for ZIP 60602: 6,018 heating degree days. O'Hare 99% heating design temperature: 4.5°F, so ΔT = 70 − 4.5 = 65.5°F.
- Math
- 0.276 × 65.5 = 18.1 and 0.379 × 65.5 = 24.8 BTU/h per sq ft. × 150 sq ft = 2,715 to 3,720 BTU/h. ÷ 3.412 = 796 to 1,090 W.
- Answer
- About 2,700 to 3,700 BTU/h (800 to 1,100 W), against 4,500 to 9,000 from the 30 to 60 rule.
Design temperature and BTU per square foot in 39 cities
Table 3 gives the result for 39 cities. Design temperatures are the 99% heating values packaged with each airport’s TMYx 2011 to 2025 weather file at Climate.OneBuilding.Org, built from NOAA’s hourly Integrated Surface Database;18 HDD are NOAA’s 1991 to 2020 normals for the ZIP’s nearest station.17 Against ENERGY STAR’s county limits, which use the lowest station in a county, our values for 21 cities are 2.6°F warmer on average (range −1.1 to +4.6°F).
| City (ZIP) | HDD | Design °F | ΔT °F | Estimate, Btu/h per sq ft | Table row |
|---|---|---|---|---|---|
| Fargo, ND (58102) | 8,806 | -13.2 | 83.2 | 23.0 to 31.5 | 5 |
| Minneapolis, MN (55401) | 7,699 | -5.1 | 75.1 | 20.7 to 28.5 | 5 |
| Billings, MT (59101) | 6,955 | -2.4 | 72.4 | 20.0 to 27.5 | 5 |
| Madison, WI (53703) | 7,096 | -1.1 | 71.1 | 19.6 to 27.0 | 5 |
| Burlington, VT (05401) | 6,960 | -0.6 | 70.6 | 19.5 to 26.8 | 5 |
| Des Moines, IA (50309) | 6,178 | 1.0 | 69.0 | 19.0 to 26.2 | – |
| Omaha, NE (68102) | 5,833 | 2.3 | 67.7 | 18.7 to 25.7 | – |
| Chicago, IL (60602) | 6,018 | 4.5 | 65.5 | 18.1 to 24.8 | – |
| Albany, NY (12207) | 6,357 | 5.4 | 64.6 | 17.8 to 24.5 | 4 |
| Portland ME, ME (04101) | 6,795 | 5.9 | 64.1 | 17.7 to 24.3 | 5 |
| Denver, CO (80202) | 5,262 | 6.4 | 63.6 | 17.5 to 24.1 | – |
| Kansas City, MO (64106) | 4,613 | 7.9 | 62.1 | 17.1 to 23.5 | – |
| Detroit, MI (48226) | 6,106 | 8.4 | 61.6 | 17.0 to 23.4 | – |
| Indianapolis, IN (46204) | 5,704 | 9.0 | 61.0 | 16.8 to 23.1 | – |
| Pittsburgh, PA (15222) | 5,379 | 10.0 | 60.0 | 16.6 to 22.7 | 4 |
| Cleveland, OH (44114) | 5,513 | 10.2 | 59.8 | 16.5 to 22.7 | 4 |
| Columbus, OH (43215) | 5,417 | 10.9 | 59.1 | 16.3 to 22.4 | 4 |
| Spokane, WA (99201) | 6,463 | 12.2 | 57.8 | 15.9 to 21.9 | – |
| St. Louis, MO (63101) | 4,292 | 13.1 | 56.9 | 15.7 to 21.6 | – |
| Boston, MA (02108) | 5,545 | 13.6 | 56.4 | 15.6 to 21.4 | 5 |
| Albuquerque, NM (87102) | 3,996 | 15.6 | 54.4 | 15.0 to 20.6 | – |
| Salt Lake City, UT (84101) | 4,724 | 16.0 | 54.0 | 14.9 to 20.5 | – |
| Louisville, KY (40202) | 4,141 | 16.3 | 53.7 | 14.8 to 20.4 | – |
| Boise, ID (83702) | 6,167 | 16.7 | 53.3 | 14.7 to 20.2 | – |
| New York, NY (10001) | 4,553 | 17.6 | 52.4 | 14.5 to 19.9 | 4 |
| Nashville, TN (37201) | 3,648 | 20.3 | 49.7 | 13.7 to 18.8 | 3 |
| Raleigh, NC (27601) | 3,165 | 24.4 | 45.6 | 12.6 to 17.3 | 3 |
| Charlotte, NC (28202) | 3,058 | 25.3 | 44.7 | 12.3 to 16.9 | 3 |
| Atlanta, GA (30303) | 2,775 | 27.1 | 42.9 | 11.8 to 16.3 | 2 |
| Dallas, TX (75201) | 1,992 | 27.7 | 42.3 | 11.7 to 16.0 | – |
| Portland, OR (97204) | 4,167 | 29.5 | 40.5 | 11.2 to 15.4 | 4 |
| Seattle, WA (98101) | 4,340 | 30.2 | 39.8 | 11.0 to 15.1 | – |
| Sacramento, CA (95814) | 2,138 | 32.7 | 37.3 | 10.3 to 14.1 | 3 |
| Houston, TX (77002) | 1,222 | 34.7 | 35.3 | 9.7 to 13.4 | 1 |
| Las Vegas, NV (89101) | 1,839 | 35.8 | 34.2 | 9.4 to 13.0 | – |
| Phoenix, AZ (85004) | 874 | 42.3 | 27.7 | 7.6 to 10.5 | 2 |
| Tampa, FL (33602) | 434 | 44.1 | 25.9 | 7.1 to 9.8 | – |
| Los Angeles, CA (90012) | 1,236 | 46.9 | 23.1 | 6.4 to 8.8 | – |
| Miami, FL (33130) | 214 | 53.1 | 16.9 | 4.7 to 6.4 | 1 |

How far the rule-of-thumb tables miss
We placed 21 of the 39 cities in the table row that names their state or region (Atlanta in Zone 2, Minneapolis in Zone 5) and divided the row’s midpoint by our estimate. The table runs 1.7 to 7.0 times the estimate, and the multiple falls as the climate gets colder: Zone 1 cities average 3.8 to 5.2 times, Zone 5 cities 2.1 to 2.9. The table’s climate scale is compressed too: its Zone 5 midpoint is 1.7 times Zone 1’s, close to the 1.8 times between DOE’s Chicago and Orlando houses, but the same house would see 2.7 times the ΔT.
| Row | Table, Btu/h per sq ft | Cities placed | Average ΔT °F | Estimate | Table ÷ estimate |
|---|---|---|---|---|---|
| Zone 1 | 30 to 35 | Houston, Miami | 26 | 7.2 to 9.9 | 3.8 to 5.2 |
| Zone 2 | 35 to 40 | Atlanta, Phoenix | 35 | 9.7 to 13.4 | 2.9 to 4.0 |
| Zone 3 | 40 to 45 | Charlotte, Nashville, Raleigh, Sacramento | 44 | 12.2 to 16.8 | 2.6 to 3.5 |
| Zone 4 | 45 to 50 | Albany, Cleveland, Columbus, New York, Pittsburgh, Portland | 56 | 15.5 to 21.3 | 2.3 to 3.1 |
| Zone 5 | 50 to 60 | Billings, Boston, Burlington, Fargo, Madison, Minneapolis, Portland ME | 70 | 19.4 to 26.7 | 2.1 to 2.9 |

Across the country the same logic gives a ZIP-code statistic. We estimated each ZIP’s design temperature from its NOAA coldest-month average low, using a straight-line fit to the 39 airports (R² 0.97, typical error 2.6°F). The median ZIP has a ΔT of 57°F. For the same house, 69% of ZIPs are within 25% of that median; 19% are milder (the house needs more than 25% less per square foot) and 12% are colder (more than 25% more). Shifting every design temperature 5°F colder or warmer moves the 69% to between 65% and 72%.
| Design temperature | ZIP codes (share) | Median ΔT °F | Estimate, Btu/h per sq ft |
|---|---|---|---|
| 32 F or warmer | 4,852 (12%) | 32 | 8.9 to 12.3 |
| 15 to 31 F | 12,863 (32%) | 48 | 13.2 to 18.2 |
| 0 to 14 F | 16,770 (41%) | 62 | 17.1 to 23.5 |
| below 0 F | 6,080 (15%) | 76 | 20.8 to 28.7 |
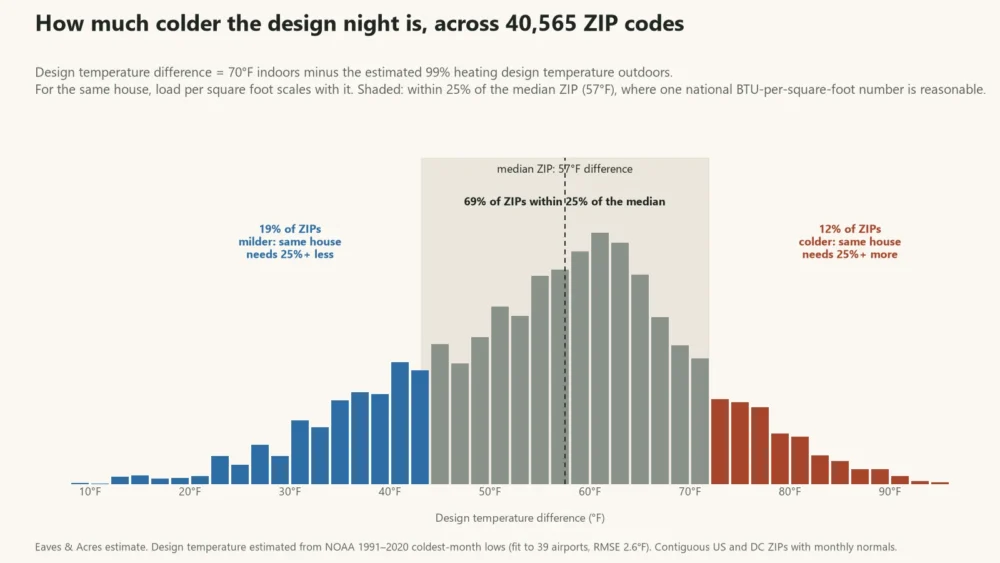
How far the 30 to 60 range misses depends on the house. If a house loses heat at the rate of DOE’s Orlando model, only 4% of ZIPs reach 30 BTU per hour per square foot; at 1.5 times that rate 62% do, and at twice that rate 86%. The popular range fits leaky or poorly insulated houses in cold places, not a code-built house almost anywhere. We found no sourced heat-loss rate for older houses to test further.
Why tables run high: padded inputs
DOE’s guide shows what padding does. It re-ran the two houses with the outdoor design temperature and indoor setpoint changed (Chicago from 2°F to −11°F, indoor to 75°F), wall, attic and window values downgraded, and infiltration raised. Each single change added 9% to 60% to the heating load, and combining all of them added 55% in Chicago and 142% in Orlando.1

Equipment sizing adds more margin. DOE’s HVAC sizing guideline says Manual S recommends a furnace stay within 140% of the peak heating load estimate,2 and ENERGY STAR’s report uses 100 to 140% for heating-only equipment.3 A table output is therefore not a load. Our furnace lifespan guide quotes Minnesota Commerce on how an oversized furnace cycles more often, and our cold-weather heat pump guide pairs NOAA lows with 99% design temperatures; the heat pump vs. furnace guide covers running cost.
Room-size examples
Table 6 applies the numbers to common room sizes. The estimate columns use Table 3’s range for a home like DOE’s two models; a single room with more exterior wall or window than the house average needs more per square foot, which is why Manual J works room by room. For a room that borders unheated space, or in an older house, scale up and treat the answer as a floor, not a purchase size.
| Room | 30 to 60 rule | Atlanta estimate | Chicago estimate | Minneapolis estimate |
|---|---|---|---|---|
| 10 × 10 ft (100 sq ft) | 3,000 to 6,000 | 1,200 to 1,600 | 1,800 to 2,500 | 2,100 to 2,800 |
| 12 × 12 ft (144 sq ft) | 4,300 to 8,600 | 1,700 to 2,300 | 2,600 to 3,600 | 3,000 to 4,100 |
| 12 × 16 ft (192 sq ft) | 5,800 to 11,500 | 2,300 to 3,100 | 3,500 to 4,800 | 4,000 to 5,500 |
| 16 × 20 ft (320 sq ft) | 9,600 to 19,200 | 3,800 to 5,200 | 5,800 to 7,900 | 6,600 to 9,100 |
| 20 × 20 ft (400 sq ft) | 12,000 to 24,000 | 4,700 to 6,500 | 7,200 to 9,900 | 8,300 to 11,400 |
Finding your own number
You can check a house against its bill. Yearly heat delivered equals the heat-loss rate × 24 hours × heating degree days (see our heating degree days guide), so the rate is yearly heat ÷ (24 × HDD). Our example home in the heat pump guide uses 72.2 million BTU at Chicago’s 6,018 HDD: 72,200,000 ÷ (24 × 6,018) = 500 BTU per hour per °F. At Chicago’s design ΔT of 65.5°F it would need 500 × 65.5 = 32,750 BTU per hour. That checks a real house; it does not replace a contractor’s Manual J. The thermostat guide and space heater cost guide use the same home.
Next step
Pick your closest city in Table 3, take its range, multiply by your square footage, and treat it as a floor for comparison; then ask for a Manual J load calculation before buying central equipment. Our methodology page explains the NOAA data behind the estimates.
Frequently asked questions
A 144 sq ft room is 4,300 to 8,600 BTU per hour by the popular 30 to 60 rule. Our estimate for a home like DOE’s two models is 1,700 to 2,300 in Atlanta and 2,600 to 3,600 in Chicago. A room with more exterior wall needs more; only a Manual J gives a room number.
Divide BTU per hour by 3.412. A retailer’s 10 watts per square foot rule is 34.1 BTU per hour per square foot, so 1,500 W covers 150 square feet by that rule. Consumer Reports says tested 1,500 W heaters claim only about 150 to 200 square feet.
It is 11,723 W of heat. By the 30 to 60 rule it covers 667 to 1,333 sq ft; at DOE’s Chicago model rate (18.8) about 2,100 sq ft. A furnace’s heat output is its input times its AFUE, so a 95% furnace with 40,000 BTU input delivers 38,000.
20,000 BTU per hour covers 333 sq ft at 60 BTU per sq ft, 667 at 30, 1,064 at 18.8 and 1,887 at 10.6. A 30,000 BTU output covers 500 to 1,000 sq ft by the 30 to 60 rule and about 1,600 at 18.8.
One heating-supply retailer uses 10 W per sq ft (12.5 for older homes, 8.5 for ultra-insulated) for 8 ft ceilings. We found no source for 20 to 30 W per sq ft; that would be 68 to 102 BTU per hour per square foot.
For the same house, yes: load scales with the design temperature difference, so Minneapolis (75°F) needs about 1.8 times Atlanta (43°F). The popular five-zone table spreads only 1.7 times from Zone 1 to Zone 5.
They are Manual J results for two modeled 2009-code homes. DOE’s author says rules of thumb were built for older construction, and padded inputs raised the loads 55% and 142%. Older homes can need more; we found no sourced rate for them.
DOE says not to buy an oversized small space heater, and Manual S recommends a furnace stay within 140% of the peak load estimate. Size from a Manual J load, not from a padded rule.
Sources
- 1.Strategy Guideline: Accurate Heating and Cooling Load Calculations (NREL/SR-5500-51603). Arlan Burdick, IBACOS, for U.S. DOE Building America / NREL, 2011. Used for: Chicago and Orlando houses: 41,700 and 23,600 Btu/h at 2°F and 42°F, 2,223 sq ft above grade, 70°F indoor; padding tests (Tables 6 to 19); rules of thumb have not changed Back to text
- 2.Strategy Guideline: HVAC Equipment Sizing. Arlan Burdick, IBACOS, for U.S. DOE Building America, 2012. Used for: Manual S: furnace within 140% of peak heating load estimate; Manual J and Manual S roles Back to text
- 3.ENERGY STAR Single-Family New Homes National HVAC Design Report, Version 3.1 / 3.2 / 3.3 (Rev. 14). ENERGY STAR (U.S. EPA), 2025. Used for: indoor design 70°F heating; room-by-room loads; 100 to 140% heating-only sizing limit Back to text
- 4.ENERGY STAR Certified Homes Design Temperature Limit Reference Guide (rev. 09/01/2018). ENERGY STAR (U.S. EPA), 2018. Used for: EPA recommends the Manual J 99% heating design temperature of the closest weather location; county limits use the lowest station Back to text
- 5.Manual J Residential Load Calculation. Air Conditioning Contractors of America (ACCA), read 2026-10-26. Used for: ANSI-recognized standard for equipment sizing loads for single-family homes, townhouses, condos Back to text
- 6.Units and calculators explained: British thermal units. U.S. Energy Information Administration, read 2026-10-26. Used for: 1 kWh = 3,412 Btu; Btu definition Back to text
- 7.Energy Saver: Small Space Heaters (archived copy of 2026-06-29; the live page has been removed). U.S. Department of Energy, 2026. Used for: proper size for the room, do not buy oversized heaters, most heaters come with a sizing table Back to text
- 8.Energy Saver: Electric Resistance Heating (archived copy of 2026-01-01; the live page has been removed). U.S. Department of Energy, 2026. Used for: all incoming electric energy is converted to heat Back to text
- 9.Will Using a Space Heater Save You Money?. Consumer Reports, 2025 (updated October 12). Used for: tested heaters claimed to heat about 150 to 200 square feet; most use 1,500 watts; supplemental heat Back to text
- 10.Keep Warm and Safe This Winter: Tips for Using Generators, Furnaces and Space Heaters. U.S. Consumer Product Safety Commission, 2026. Used for: three feet from combustibles; plug into a wall outlet, never an extension cord or power strip Back to text
- 11.Heat Pump Size Calculator: Sizing Guide (Carrier). Carrier, read 2026-10-26. Used for: about 20 to 30 BTU per sq ft; chart is a general estimate, not a Manual J Back to text
- 12.BTU Calculator: What Size AC or Heater Do I Need?. National Air Warehouse, updated 2026-10-26. Used for: five-zone heating table 30 to 35 up to 50 to 60 BTU per sq ft; furnace output = input x AFUE Back to text
- 13.Furnace BTU Calculator. Inch Calculator, 2023. Used for: the same five-zone table; experts suggest 30 to 60 BTU per sq ft; poor insulation 10% more Back to text
- 14.BTU Calculator: How Many BTUs Do I Need?. Universal HVAC Group (Chicago contractor), updated 2026-10-19. Used for: heating about 30 to 60 BTU per sq ft; 1 watt = 3.412 BTU per hour Back to text
- 15.BTU Calculator (Heating): How Many BTUs Do I Need for a Room?. We Love Fire, updated 2025-01-15. Used for: 10 to 15 warm, 20 to 30 moderate, 30 to 40 cold; chart 20 / 30 / 45 BTU per sq ft by insulation up to 1,000 sq ft Back to text
- 16.Electric Baseboard Heater Sizing. Sheets Supply, read 2026-10-26. Used for: 10 watts per sq ft for modern construction and 8 ft ceilings; 12.5 older; 8.5 ultra-insulated Back to text
- 17.U.S. Climate Normals 1991-2020 (annual heating degree days, monthly normals). NOAA NCEI, 2021. Used for: HDD and coldest-month average low by station; same values as wp_ea_climate Back to text
- 18.TMYx 2011-2025 weather files with .ddy design conditions (99% heating dry-bulb for 39 airports). Climate.OneBuilding.Org, 2025. Used for: design temperatures from design-day files packaged with TMYx files built from NOAA ISD hourly data; third-party, not ASHRAE tables Back to text
- 19.BTU Calculator: Heating BTUs by Sq Ft. MBTEK, 2022. Used for: 20, 30, 40 or 50 BTU per sq ft by climate and building; screening tool Back to text
- 20.Manual J and HVAC Design. Green Building Advisor (Allison A. Bailes III, PhD), 2012. Used for: 99% design temperature definition: stays above for 99% of hours, about 88 hours colder Back to text
How this guide was made
- Written by the Home Systems Desk and reviewed by the Data & Methodology Desk.
- Data: Design heat loss per sq ft = (heat-loss rate of DOE’s Chicago or Orlando model, 0.276 or 0.379 Btu/h per °F per above-grade sq ft) × (70°F − 99% heating design temperature). Design temperatures: Climate.OneBuilding.Org TMYx 2011–2025 airport files (39 cities); 21 of them average 2.6°F warmer than ENERGY STAR county limits. HDD: NOAA NCEI 1991–2020 normals, nearest station to the ZIP. ZIP design temperature = -14.81 + 1.183 × coldest-month average low (R² 0.97, RMSE 2.6°F, leave-one-out 2.8°F), for 40,565 contiguous-US and DC ZIPs. Estimates are not Manual J load calculations; two modeled houses are a thin base and older houses lose more. See our methodology.
- AI use: AI tools help us research, draft and check this guide. Every figure is checked against the source cited for it, and calculated figures come from our own code, described on the methodology page.
- Spotted an error? Tell us — the form opens with this page’s address filled in.
Change log
- Oct 26, 2026Published as a draft. DOE Building America (2011, 2012), ENERGY STAR design report and temperature guide, ACCA, EIA, DOE Energy Saver, Consumer Reports, CPSC, Carrier and six retailer and contractor rule pages read; NOAA normals and 99% design temperatures used for a 39-city test and a 40,565-ZIP estimate.
Covers heating, cooling, generators and water heaters. We maintain the sizing calculators and the guides that explain what a number means before you call a contractor.
Keep reading

How Long Does a Furnace Last? DOE, NAHB and Manufacturer Figures Compared
Sources put furnace life at 15 to 22 years: NAHB says gas 18, Minnesota 15 to 20, DOE 21.4. We show why they differ and estimate run hours for 20 cities from NOAA data.

How to Winterize Your House: A Fall Checklist With Dates
The typical US ZIP code gets its first freeze around October 25. A deadline-ordered fall checklist for caulk, hoses, gutters, attic, furnace and alarms, with dates for 24 cities and what labels, CPSC and extension services say.
When to Turn On the Heat in Fall: City and State Dates
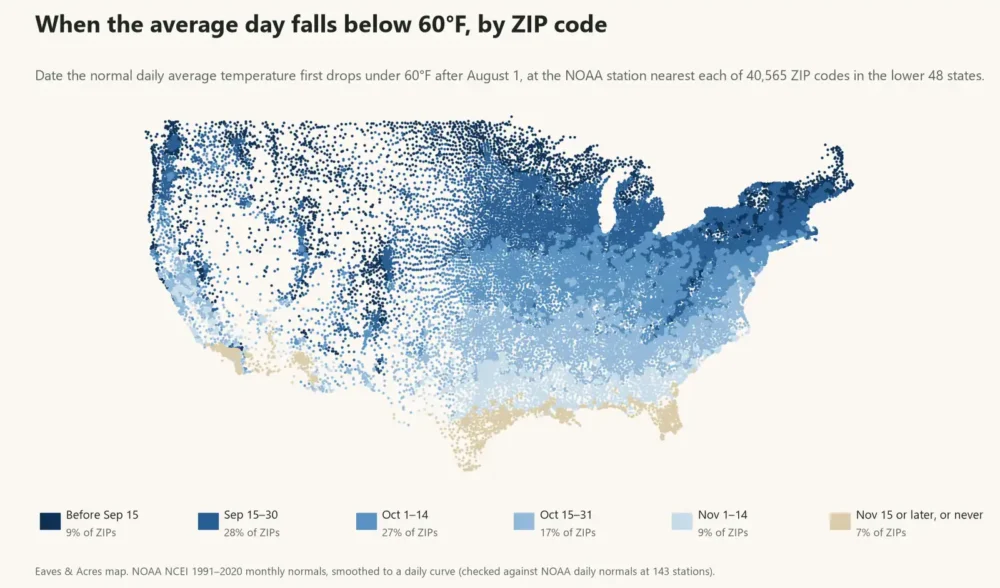
In the typical US ZIP code the average day falls below 60°F around October 5. Dates for 24 cities and every state, seven landlord heat rules, and what a furnace manual says to check first.
Seasonal reminders for your ZIP
Get a short email when it’s time to overseed, start seeds, open the pool or service your furnace — timed to your climate.