



Heating Degree Days: How They Work and Totals by State and ZIP
One degree below 65°F for one day. Here is how the count works, why adding up average temperatures undercounts it, and what NOAA’s 1991–2020 normals say for every state, 20 cities and about 40,700 ZIP codes.
- Last reviewed Oct 22, 2026
- 14 cited sources
- 12 min read


- 1A heating degree day is one degree that a day’s average temperature (high plus low, divided by two) falls below 65°F; days at or above 65°F count zero, and a year’s total adds the days.
- 2In NOAA’s 1991–2020 normals the yearly total runs from 158 in Homestead, Florida to 8,806 in Fargo, and the median of 40,735 ZIP codes is 4,931. State medians run from 468 (Florida) to 9,063 (North Dakota), with Alaska at 10,385.
- 365°F is a convention, not your house. A lower base cuts the count most in mild climates: at 55°F Chicago keeps 62% of its 6,018, Phoenix only 15% of its 874.
- 4Averaging temperatures undercounts: the “65 minus the monthly normal” shortcut was low at NOAA stations by a median 3.3%, and by 16% at stations under 2,000 HDD a year. Use NOAA’s own totals.
- 5On a bill, divide fuel used (minus the base load from mild months) by the degree days. If use per degree day rises, the house or fuel use changed, not just the weather.
A heating degree day (HDD) is one degree that a day’s average outdoor temperature falls below 65°F, and a year’s total adds those degrees up. In NOAA’s 1991–2020 normals the total runs from 158 in Homestead, Florida to 8,806 in Fargo, with the typical US ZIP code near 4,900. A bigger number means more heating, but only roughly, because your house sets the rest.1,2
This guide explains how the count works, why the base is 65°F, and why adding up average temperatures undercounts it. It then maps NOAA’s annual normals for every state, 20 cities and about 40,700 ZIP codes. For what to do with the number, see our winter thermostat guide and heat pump vs. furnace cost guide, which both use it.
How heating degree days are calculated
For one day, take the high and low, average them, and subtract that average from 65°F. If the average is 65°F or higher, the day counts zero. The National Weather Service gives a day with a 33°F high and a 25°F low: the average is 29°F, so 65 − 29 = 36 heating degree days.1 The Energy Information Administration (EIA) uses the same example and the same 65°F base for the United States.2
The months and years are sums of the days. A month with every day averaging 55°F is 10 × 30 = 300 HDD; the American Gas Association puts it as a day at 35°F giving 30 degree days.7 Cooling degree days (CDD) are the mirror image: degrees above 65°F.
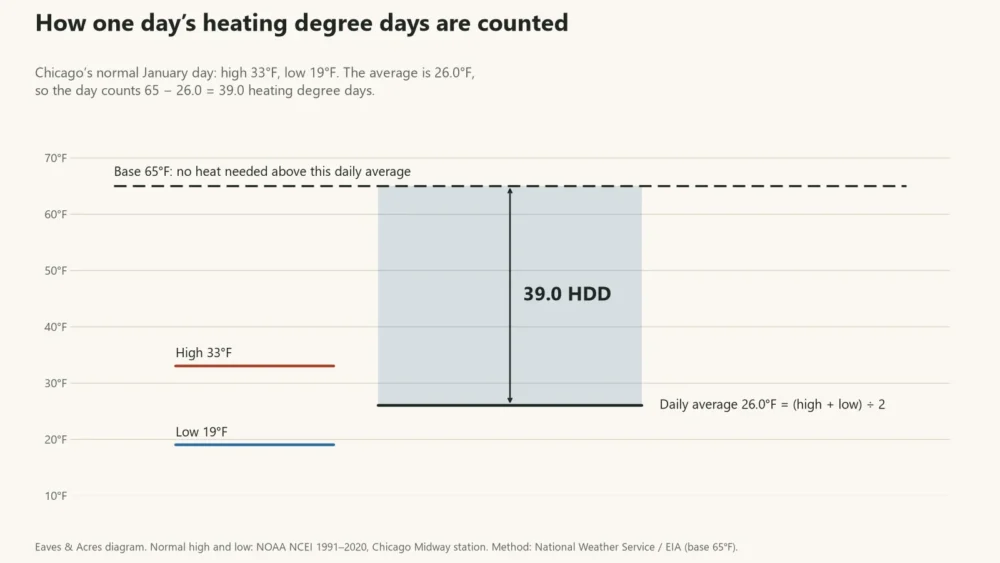
The unit is a degree-day: degrees below the base, times days. It has no dollar or energy meaning by itself. What makes it useful is that heating fuel use tracks it closely. The NWS compares it to a trip odometer, and so can you:
Then, using the degree days, you could determine “how far you went” during those periods.
Why the base is 65°F, and when it is wrong
The 65°F base is a convention for comparing places and years, not a measurement of your house. A building kept at 68–70°F needs heat only when the outdoor average falls below its own balance point, the temperature at which free heat from people, appliances and sunshine makes up the difference. Degree Days.net, a data provider, notes that real buildings seldom match a preset base. It roughly estimates the free heat in a well-insulated building with many people and appliances at about 9°F (5°C), and sun through a moderate amount of south-facing glass at about 2°F (1°C) at most.6


A lower balance point means fewer degree days. NOAA publishes its normals at several bases, so we can show how much the base matters in the same 20 cities. At a 60°F base, Chicago counts 80% of its usual 6,018; at 55°F, 62%. Phoenix drops to 45% and 15%, because its winter days barely sit below 65°F to begin with.4
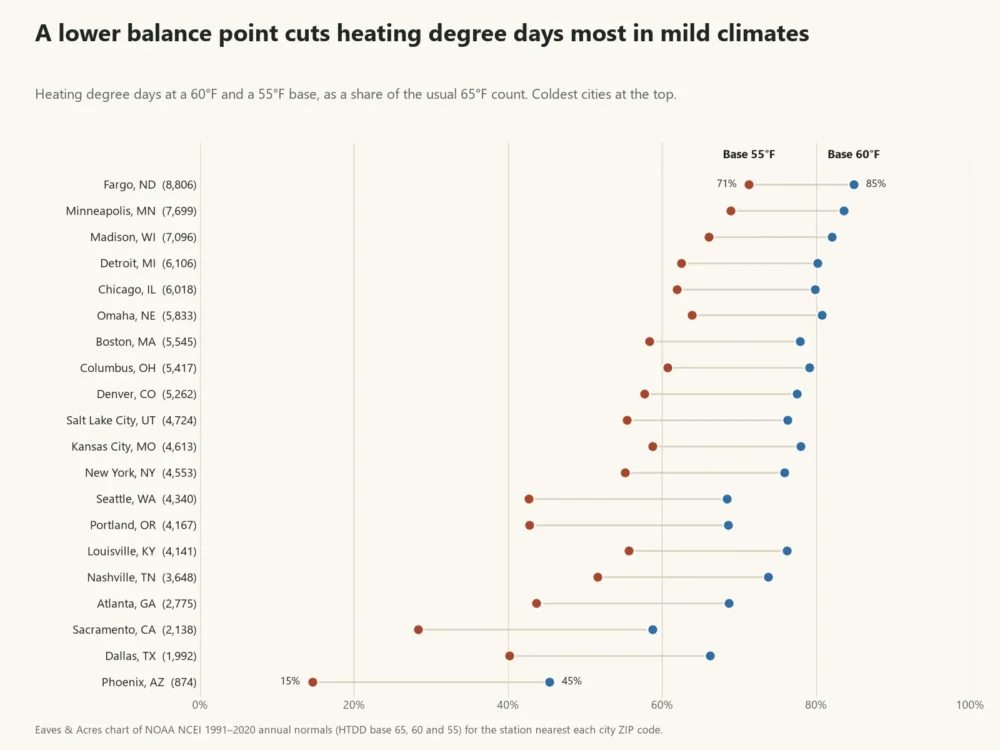
The same effect is why an 8°F night setback saves a bigger share of the heating bill in mild climates than in cold ones: our thermostat guide prices it with the 57°F base and finds 7.8% in Fargo against 25% in Phoenix.
Why adding up average temperatures undercounts
You might expect a month’s HDD to equal 30 × (65 − the month’s average temperature). It does not. A day that averages above 65°F counts zero, never negative, so mild days cannot cancel out the cold ones, and the sum of the days is larger than the monthly average implies. NOAA does not subtract the monthly average. It builds each station’s daily normal from the spread of 30 years of daily values around the daily normal, and sums the days.3
This is critical since the definition of HDD/CDD is constructed as an asymmetric sum.
We measured the gap at 5,988 NOAA stations with both annual HDD and monthly temperature normals. The “65 minus the normal temperature” shortcut comes in low everywhere. The median shortfall is 3.3%, about 180 degree days a year in most climates, but 16% at stations with fewer than 2,000 HDD a year. In Chicago it is 5,846 against NOAA’s 6,018 (2.9% low).4
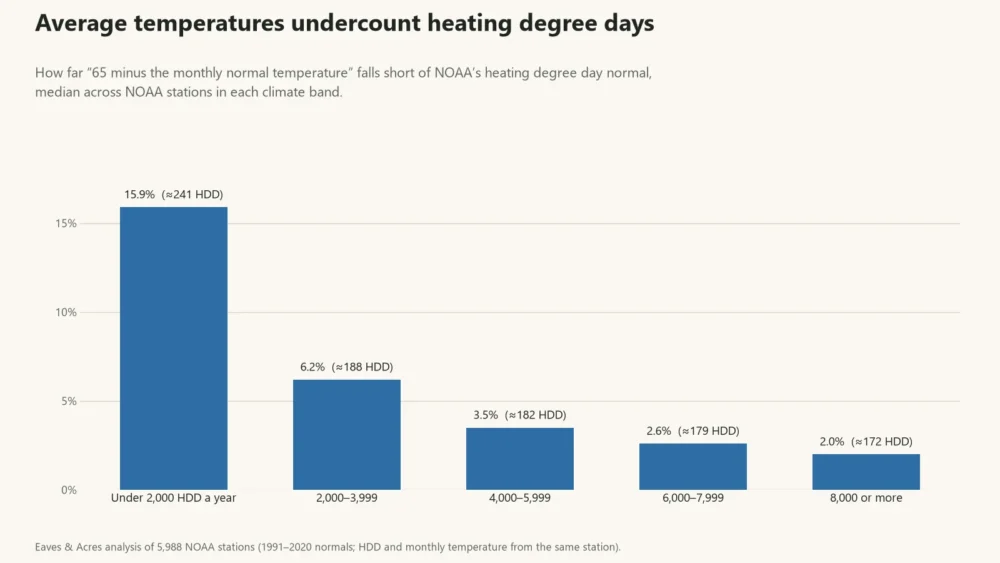
The practical point: use NOAA’s own annual and monthly HDD where you can, rather than recomputing them from average temperatures. Utilities may also use their own normals: National Grid’s upstate New York gas table, for example, holds its normal fixed to a 30-year period (1992–2022) until its next rate case, so a utility’s normal and NOAA’s can differ.9
Heating degree days by state
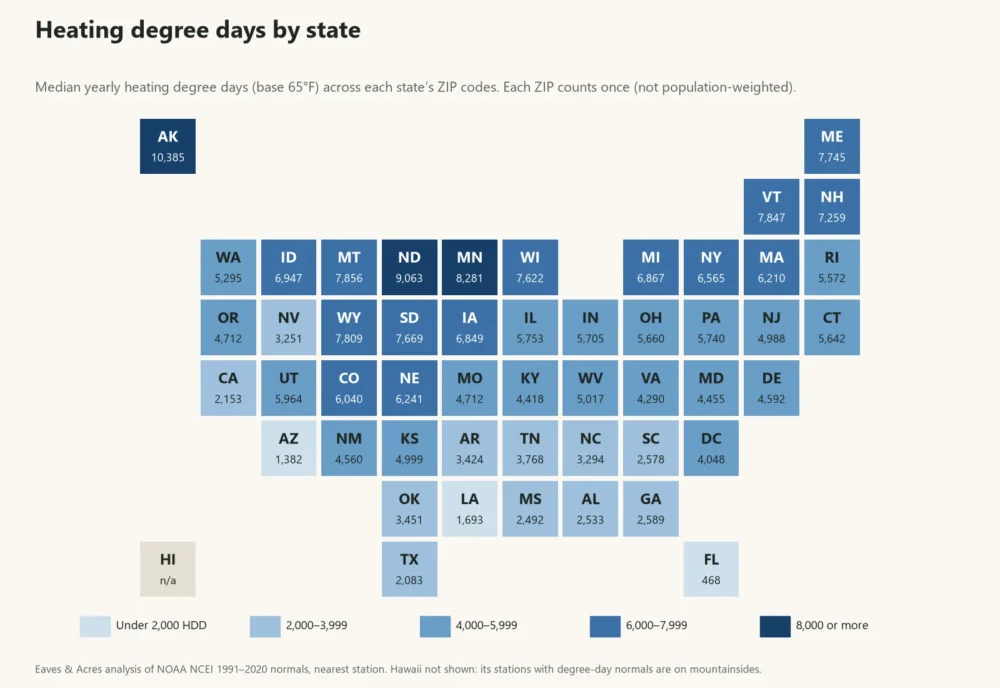
Table 1 lists every state’s median across its ZIP codes, using NOAA 1991–2020 normals from the station nearest each ZIP. North Dakota (9,063) and Minnesota (8,281) lead the lower 48; Alaska’s median is 10,385. Florida (468), Arizona (1,382) and Louisiana (1,693) are lowest. The median ZIP code in the whole country has 4,931.4
| State | Median HDD | Middle 80% of ZIPs (HDD) | Median CDD |
|---|---|---|---|
| AK | 10,385 | 7,827–13,928 | 7 |
| ND | 9,063 | 8,446–9,968 | 416 |
| MN | 8,281 | 7,624–9,761 | 533 |
| MT | 7,856 | 6,942–9,076 | 293 |
| VT | 7,847 | 7,220–8,857 | 311 |
| WY | 7,809 | 6,959–9,504 | 342 |
| ME | 7,745 | 6,835–8,950 | 298 |
| SD | 7,669 | 6,884–8,589 | 661 |
| WI | 7,622 | 6,928–8,864 | 511 |
| NH | 7,259 | 6,775–8,364 | 410 |
| ID | 6,947 | 5,320–8,391 | 366 |
| MI | 6,867 | 6,297–8,477 | 559 |
| IA | 6,849 | 6,201–7,568 | 814 |
| NY | 6,565 | 4,561–7,773 | 578 |
| NE | 6,241 | 5,856–6,916 | 993 |
| MA | 6,210 | 5,545–6,919 | 621 |
| CO | 6,040 | 5,262–9,044 | 608 |
| UT | 5,964 | 4,724–7,604 | 794 |
| IL | 5,753 | 4,624–6,506 | 1,040 |
| PA | 5,740 | 5,008–6,962 | 770 |
| IN | 5,705 | 4,436–6,258 | 917 |
| OH | 5,660 | 5,111–6,282 | 870 |
| CT | 5,642 | 5,358–6,556 | 765 |
| RI | 5,572 | 5,268–6,173 | 760 |
| WA | 5,295 | 4,340–6,867 | 211 |
| WV | 5,017 | 4,353–5,828 | 890 |
| KS | 4,999 | 4,492–5,664 | 1,434 |
| NJ | 4,988 | 4,523–5,635 | 1,017 |
| MO | 4,712 | 4,146–5,718 | 1,352 |
| OR | 4,712 | 4,149–6,655 | 349 |
| DE | 4,592 | 4,070–5,181 | 1,228 |
| NM | 4,560 | 2,876–6,411 | 914 |
| MD | 4,455 | 3,858–5,034 | 1,284 |
| KY | 4,418 | 4,016–4,857 | 1,175 |
| VA | 4,290 | 3,536–5,113 | 1,270 |
| DC | 4,048 | 3,769–4,048 | 1,648 |
| TN | 3,768 | 3,188–4,327 | 1,526 |
| OK | 3,451 | 3,079–4,062 | 1,980 |
| AR | 3,424 | 2,853–4,157 | 1,881 |
| NC | 3,294 | 2,767–4,199 | 1,640 |
| NV | 3,251 | 1,836–6,793 | 2,103 |
| GA | 2,589 | 1,734–3,241 | 1,932 |
| SC | 2,578 | 1,844–3,332 | 1,965 |
| AL | 2,533 | 1,755–3,334 | 2,107 |
| MS | 2,492 | 1,893–3,192 | 2,291 |
| CA | 2,153 | 1,236–4,178 | 1,246 |
| TX | 2,083 | 1,148–2,863 | 2,690 |
| LA | 1,693 | 1,206–2,322 | 2,675 |
| AZ | 1,382 | 874–4,926 | 3,538 |
| FL | 468 | 230–1,354 | 3,502 |
These are medians over ZIP codes, so each ZIP counts once. EIA’s national and state figures are population-weighted, which tilts them toward cities.2
Degree days can be weighted based on the population of a region.
That is why you will see a US average near 3,900–4,000 elsewhere. One page Google’s AI Overview cites beside that figure, a Town of Monroe, Connecticut PDF, is an October 2006 LP/Gas magazine page whose 3,965 is the United States total for the preceding 12 months, not a 30-year normal.8 Our unweighted ZIP median is higher, partly because many ZIP codes sit in cold, thinly populated places.
A state is not one number. Colorado runs from 4,547 to 11,084 between its ZIP codes, California from 674 to 7,935, and Arizona’s middle 80% spans 874 to 4,926. Hawaii is left out of the table and the maps: the only Hawaii stations with degree-day normals in our dataset sit at 3,600 and 11,179 feet, so they say nothing about the coast.
Heating degree days by ZIP code and city
The ZIP map shows the whole pattern. Across 40,735 ZIP codes (lower 48 and Alaska), 13% have fewer than 2,000 HDD, 22% have 2,000–3,999, 34% have 4,000–5,999, 24% have 6,000–7,999 and 7% have 8,000 or more.4 Elevation shows up too: the lower-48 maximum is Almont, Colorado at 11,084, from a station at 9,179 feet, while Homestead, Florida sits at 158.
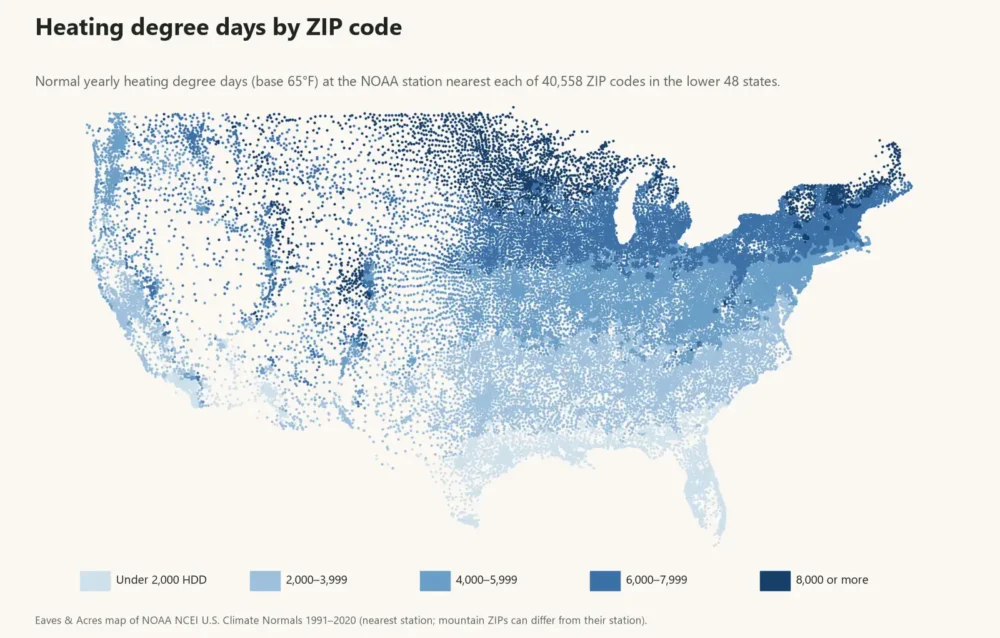
To see yours, enter your ZIP code in the box on our home page; the “Heating / cooling degree days” line then shows your annual heating and cooling totals and the NOAA station they come from. A ZIP gets its station’s number, not a measurement at your address, and a few ZIP codes have no station within 50 miles. Table 2 shows 20 large cities, using the same stations as our thermostat and heat pump guides.
| City (ZIP) | Yearly HDD | Yearly CDD | January HDD | Peak month | vs. median ZIP | Example home, therms a year |
|---|---|---|---|---|---|---|
| Fargo, ND (58102) | 8,806 | 542 | 1,730 | Jan | 1.79× | 1,112 |
| Minneapolis, MN (55401) | 7,699 | 734 | 1,553 | Jan | 1.56× | 973 |
| Madison, WI (53703) | 7,096 | 640 | 1,413 | Jan | 1.44× | 896 |
| Detroit, MI (48226) | 6,106 | 854 | 1,206 | Jan | 1.24× | 771 |
| Chicago, IL (60602) | 6,018 | 862 | 1,209 | Jan | 1.22× | 760 |
| Omaha, NE (68102) | 5,833 | 1,294 | 1,258 | Jan | 1.18× | 737 |
| Boston, MA (02108) | 5,545 | 802 | 1,086 | Jan | 1.12× | 700 |
| Columbus, OH (43215) | 5,417 | 995 | 1,125 | Jan | 1.10× | 684 |
| Denver, CO (80202) | 5,262 | 1,045 | 933 | Dec | 1.07× | 665 |
| Salt Lake City, UT (84101) | 4,724 | 1,402 | 972 | Jan | 0.96× | 597 |
| Kansas City, MO (64106) | 4,613 | 1,708 | 1,052 | Jan | 0.94× | 583 |
| New York, NY (10001) | 4,553 | 1,222 | 970 | Jan | 0.92× | 575 |
| Seattle, WA (98101) | 4,340 | 282 | 691 | Dec | 0.88× | 548 |
| Portland, OR (97204) | 4,167 | 448 | 710 | Dec | 0.85× | 526 |
| Louisville, KY (40202) | 4,141 | 1,642 | 942 | Jan | 0.84× | 523 |
| Nashville, TN (37201) | 3,648 | 1,587 | 844 | Jan | 0.74× | 461 |
| Atlanta, GA (30303) | 2,775 | 1,825 | 664 | Jan | 0.56× | 351 |
| Sacramento, CA (95814) | 2,138 | 1,576 | 502 | Dec | 0.43× | 270 |
| Dallas, TX (75201) | 1,992 | 3,125 | 537 | Jan | 0.40× | 252 |
| Phoenix, AZ (85004) | 874 | 4,765 | 256 | Dec | 0.18× | 110 |
The months matter too. Fargo’s January alone is 1,730 HDD, nearly twice Phoenix’s whole year (874), while Seattle and Portland peak in December and spread their heating thinly over a long, mild season.
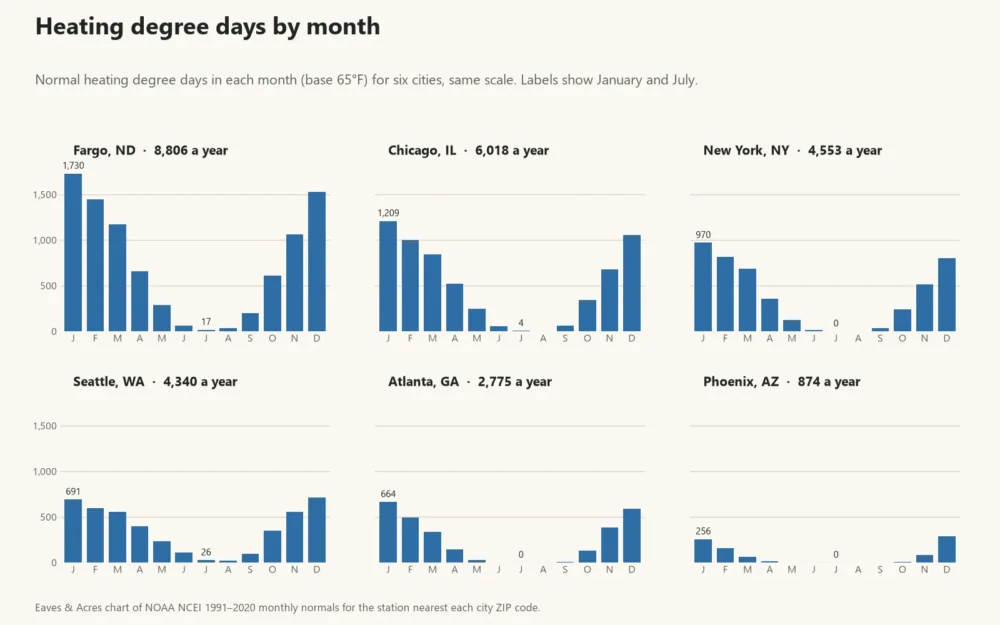
Nearly all of it falls in the cold half of the year. In these 20 cities, October through April holds 89% (Seattle) to 99.9% (Phoenix) of the year’s heating degree days, and December through February alone holds 46% (Seattle) to about 80% (Phoenix).
The formula that turns degree days into fuel
If you know how much heat a house loses per degree day, a year of HDD gives its yearly heat need. Our example home loses 12,000 Btu per HDD (500 Btu an hour for each °F, the same house as in our heat pump guide). Chicago’s 6,018 HDD then means 72.2 million Btu of heat a year. Divide by the fuel’s energy content and the equipment’s efficiency, using EIA’s conversions of 100,000 Btu per therm and 3,412 Btu per kilowatthour:10
Therms of gas = HDD × Btu per HDD ÷ furnace efficiency ÷ 100,000
For the example home that is 760 therms with a 95% efficient furnace, 21,166 kWh with electric resistance heat, and 7,055 kWh from a heat pump that averages a coefficient of performance (COP) of 3, meaning three units of heat per unit of electricity. A real heat pump’s COP changes with the outdoor temperature, which is why we price it city by city in the heat pump vs. furnace guide. This is arithmetic on one assumed house, not an estimate for yours.
What heating degree days mean on a gas or electric bill
Utilities print degree days on bills because fuel use follows them. The NWS method: add up the fuel used over a heating period, subtract the base load you see in mild months such as May and October (water heater, stove, lights), and divide what is left by the degree days.1 That gives therms or kWh per degree day, which you can compare across months and years.
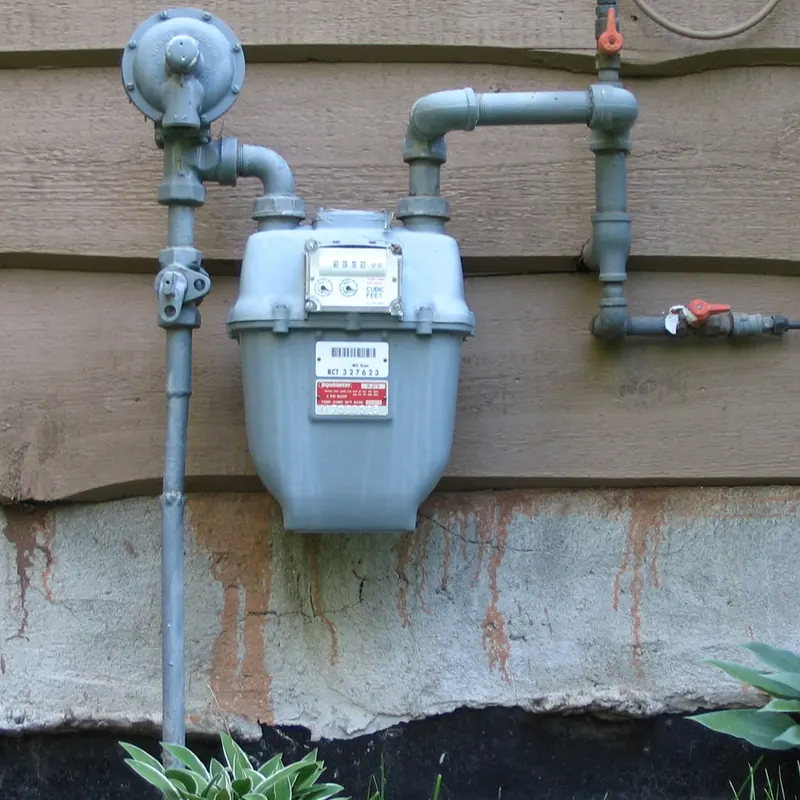

Two cautions from the NWS: a meter is read on its own schedule, so the bill’s days may not match a calendar month’s degree days, and comparing a whole season or several months smooths that out.1
Did this January's bill rise because of the house or the weather? (illustrative bills)
- Scenario
- Last January: 1,250 HDD and 170 therms. This January: 1,100 HDD and 160 therms. Base load from May: 15 therms.
- Math
- Heating therms: 170 − 15 = 155 and 160 − 15 = 145. Per degree day: 155 ÷ 1,250 = 0.124 and 145 ÷ 1,100 = 0.132.
- Answer
- The bill fell 6% but the weather was 12% milder, so the house used about 6% more heat per degree day. Weather alone does not explain it.
The bills here are made up to show the arithmetic. For scale, the example home uses 0.126 therm per HDD from a 95% efficient gas furnace. That is about 153 therms in a normal Chicago January (1,209 HDD) and 760 over the year, against 110 in Phoenix (874 HDD). Your own number can be far from that, and a rising figure can come from weather, fuel prices, a new appliance or a change in how you heat; degree days only remove the weather.
Using degree days to test a change at home
The NWS’s own example is an insulation upgrade: to learn whether attic insulation added over the summer saved energy, compare the fuel used before and after, divided by the degree days of each period.1 The same test works for a new thermostat schedule, a furnace replacement, weatherstripping or a furnace filter schedule. Use the same months in two winters, take the base load out first, and prefer a whole season or several months to a single bill, since one bill’s dates rarely match the calendar.
A realistic expectation helps. In the example above, a 6% change in therms per degree day is within the range that a different thermostat setting, a houseguest or a window left open can produce, so treat a single comparison as a hint rather than proof. Two or three winters of data, with the same base load and the same fuel, tell you far more. If the weather-corrected figure does not move after a change that should have helped, that is worth a closer look by an energy auditor or HVAC contractor, who can measure what degree days cannot: air leaks, duct losses and equipment efficiency.
Heating versus cooling degree days
CDD use the same 65°F base above rather than below. In our ZIP dataset the median ZIP has 1,032 CDD against 4,931 HDD, and cooling beats heating in only 15% of ZIP codes. Phoenix has 4,765 CDD to 874 HDD; Seattle 282 to 4,340. The two do not convert into bills the same way, because air conditioners and furnaces run on different fuels and efficiencies.
Common mix-ups when comparing degree days
They are not days. Chicago’s 6,018 is degrees multiplied by days, not a count of cold days. Bases differ. Degree Days.net notes that degree days have traditionally come in bases such as 15.5°C, 18.5°C and 65°F, so a 65°F count cannot be compared with one built on another base.6 Periods differ. Our figures are full-year normals; some utility tables also add a November–March winter total beside the year, as National Grid’s does, so check which column you are reading.9 A station is not your street. In our dataset the nearest station is a median 7 miles from a ZIP code and within 14 miles for 9 in 10, but hills, lakes and cities can make your address warmer or colder than its station. A normal is not this year. It is a 30-year typical value; any single winter can be well above or below it.
Are heating degree days falling?
For the stations where NOAA flags both the 1981–2010 and 1991–2020 normals as standard (at least 24 of 30 years of data), HDD fell at all eight we could check: Madison −2.6%, Detroit −1.0%, Omaha −5.4%, Kansas City −1.6%, New York −4.1%, Sacramento −7.1%, Dallas −6.7% and Phoenix −6.5% (median −4.8%).4 Eight stations is not a national trend, but it suggests a degree-day table built on the 1981–2010 normals runs high.
Getting degree days for a specific month or year
Normals describe a typical year; a bill needs the actual weather. The ENERGY STAR Portfolio Manager Degree Days Calculator pulls weather-station degree days for US and Canadian locations, and AGA publishes weekly and monthly HDD reports, with normals for the nine census regions.5,7 HUD USER’s heating degree days database has you pick a state and ZIP code, then lists the 20 closest weather stations and their heating and cooling degree parameters.14 For official records, the NWS points to NOAA’s National Centers for Environmental Information.1
Next step
Look up your ZIP, find your row or state in the tables above, and use it with one of our guides: the thermostat setback savings, the heat pump and furnace running costs, or the window-fog humidity ceiling, which uses the same NOAA stations. Cold-climate readers planning backup power should see the furnace generator guide and the generator size calculator.
Frequently asked questions
Add the day's high and low, divide by two, and subtract the result from 65°F. If the average is 65°F or higher, the day counts zero. A 33°F high and 25°F low average 29°F, so the day is 65 − 29 = 36 heating degree days. Monthly and yearly totals add the days.
They measure how cold the billing period was. If you subtract your base load (use in mild months) from the heating-season fuel and divide by the degree days, you get therms or kWh per degree day, which lets you compare winters. A bill that rises less than the degree days means the weather, not the house, explained it.
The sum of every day's heating degree days over a year. NOAA's 1991–2020 normals give 6,018 for Chicago's Northerly Island station, 4,553 for New York's Central Park, 874 for Phoenix, and 4,931 for the median of 40,735 US ZIP codes in our dataset.
Both use a 65°F base. Heating degree days count degrees a day's average is below 65°F; cooling degree days count degrees above it. In our ZIP dataset the median ZIP has 4,931 heating and 1,032 cooling degree days, and cooling exceeds heating in only 15% of ZIP codes.
Degree-days (degrees Fahrenheit times days). The number has no energy or dollar unit of its own; it becomes one only when you pair it with how much heat your house needs per degree day.
It is the US convention used by the National Weather Service and the Energy Information Administration so places and years can be compared. A real house's balance point is usually lower, which is why data providers let you pick other bases such as 60°F or 55°F.
Enter your ZIP code on our home page to see the NOAA 1991–2020 normal for the nearest station. For a specific month or year, the ENERGY STAR Portfolio Manager Degree Days Calculator pulls weather-station values for US and Canadian locations.
It depends on how you average. The median of 40,735 US ZIP codes in NOAA's 1991–2020 normals is 4,931. EIA's national figures are population-weighted, which gives a different number.
Sources
- 1.What Are Heating and Cooling Degree Days. National Weather Service, Key West, FL, accessed 2026-10-13. Used for: daily mean = (high + low) ÷ 2 against 65°F; 36 HDD example; using degree days like a trip odometer; base load from mild months; bill dates vs calendar months; NCEI for official records Back to text
- 2.Degree-days. U.S. Energy Information Administration, accessed 2026-10-13. Used for: 65°F base for the United States; HDD and CDD definitions; population-weighted degree days Back to text
- 3.Normals Calculation Methodology 2020. NOAA National Centers for Environmental Information, 2020. Used for: HDD/CDD normals built from daily values around the daily normal (asymmetric sum); monthly = sum of daily; annual = sum of 12 months; standard-normal flag needs 24 of 30 years Back to text
- 4.U.S. Climate Normals 1991–2020 (annual/seasonal and monthly normals, 1981–2010 for comparison). NOAA National Centers for Environmental Information, 2021. Used for: annual and monthly HDD/CDD at bases 65, 60, 55 for the station nearest each ZIP code; 1981–2010 vs 1991–2020 totals Back to text
- 5.Degree Days Calculator. ENERGY STAR Portfolio Manager, U.S. EPA, accessed 2026-10-13. Used for: pulls weather-station HDD and CDD for the US and Canada; 65°F base examples Back to text
- 6.Degree-Day Base Temperature (or Balance Point) for Heating and Cooling Degree Days. Degree Days.net, accessed 2026-10-13. Used for: real buildings seldom match a preset base; internal heat gain about 5°C (9°F) in a well-insulated busy building; solar gain about 1°C (2°F); bases 15.5°C, 18.5°C, 65°F Back to text
- 7.Weekly and Monthly Heating Degree Day Data. American Gas Association, accessed 2026-10-13. Used for: 35°F day = 30 degree-days; weekly and monthly reports; normals for the nine census regions Back to text
- 8.Heating degree days by state (LP/Gas magazine, October 2006, hosted by the Town of Monroe, CT). LP/Gas magazine via Town of Monroe, Connecticut, 2006. Used for: the 3,965 national figure is the United States total for the preceding 12 months Back to text
- 9.Heating Degree Days (Upstate NY gas service territory). National Grid, accessed 2026-10-13. Used for: utility normal fixed to a 30-year period (1992–2022) until the next rate case; November–March winter total beside the year Back to text
- 10.British thermal units (Btu). U.S. Energy Information Administration, accessed 2026-10-13. Used for: 1 kWh = 3,412 Btu; 1 therm = 100,000 Btu Back to text
- 11.Snow Across the United States (MODIS, 2024-01-23) (image). MODIS Land Rapid Response Team, NASA GSFC, Wikimedia Commons, public domain, 2024. Used for: hero image, cropped
- 12.Golden Valley Minnesota deer in snow (photo). Skyler13, Wikimedia Commons, public domain, 2009. Used for: photo, cropped
- 13.Gas meter (photo). RadRafe, Wikimedia Commons, public domain, 2005. Used for: photo, cropped
- 14.Heating Degree Days Database Area Selection. U.S. Department of Housing and Urban Development, HUD USER, accessed 2026-10-22. Used for: state and ZIP lookup that lists the 20 closest weather stations and their degree-day parameters Back to text
How this guide was made
- Written by the Home Systems Desk and reviewed by the Data & Methodology Desk.
- Data: Heating and cooling degree days are NOAA NCEI U.S. Climate Normals 1991–2020 at a 65°F base for the station nearest each ZIP code (wp_ea_climate hdd and cdd). State figures are medians across ZIP codes in the dataset (each ZIP counts once, not population-weighted like EIA), with Hawaii omitted because its degree-day stations are at 3,600 and 11,179 feet. The 20 city rows use the same stations as our thermostat, heat pump and humidity guides. Monthly values, the 60°F and 55°F bases and the 1981–2010 comparison are NOAA station files read for those stations; the shortcut check compares annual HDD with 65 minus monthly average temperature for 5,988 stations where both come from one station. The example home (12,000 Btu per HDD, 95% furnace) is the same as in our heat pump guide; bill figures in the worked example are illustrative. Estimates, not a guarantee. See our methodology.
- AI use: AI tools help us research, draft and check this guide. Every figure is checked against the source cited for it, and calculated figures come from our own code, described on the methodology page.
- Spotted an error? Tell us — the form opens with this page’s address filled in.
Change log
- Oct 22, 2026Re-read the NWS, EIA, NOAA, ENERGY STAR, AGA and Degree Days.net pages against the quotes and figures here; added HUD USER’s ZIP-to-weather-station degree-day lookup, photo credits under two photos, and shorter headers on Table 2.
- Oct 13, 2026Published. NWS, EIA, NOAA NCEI (normals methodology, 1991–2020 and 1981–2010 annual normals, monthly normals), ENERGY STAR, AGA, National Grid, EIA Btu page and Degree Days.net checked on the live pages; state, ZIP and city totals computed from NOAA 1991–2020 normals for 40,735 ZIP codes; shortcut undercount measured at 5,988 NOAA stations.
Covers heating, cooling, generators and water heaters. We maintain the sizing calculators and the guides that explain what a number means before you call a contractor.
Keep reading
How Many BTU to Heat a Room? Rules of Thumb Tested Against Design Temperatures
Popular tables say 30 to 60 BTU per square foot; DOE's modeled homes need 10.6 to 18.8. We convert BTU to watts and test the rules against design temperatures for 39 cities and 40,565 ZIP codes.

How Long Does a Furnace Last? DOE, NAHB and Manufacturer Figures Compared
Sources put furnace life at 15 to 22 years: NAHB says gas 18, Minnesota 15 to 20, DOE 21.4. We show why they differ and estimate run hours for 20 cities from NOAA data.

How to Winterize Your House: A Fall Checklist With Dates
The typical US ZIP code gets its first freeze around October 25. A deadline-ordered fall checklist for caulk, hoses, gutters, attic, furnace and alarms, with dates for 24 cities and what labels, CPSC and extension services say.
Seasonal reminders for your ZIP
Get a short email when it’s time to overseed, start seeds, open the pool or service your furnace — timed to your climate.